Figure 8.
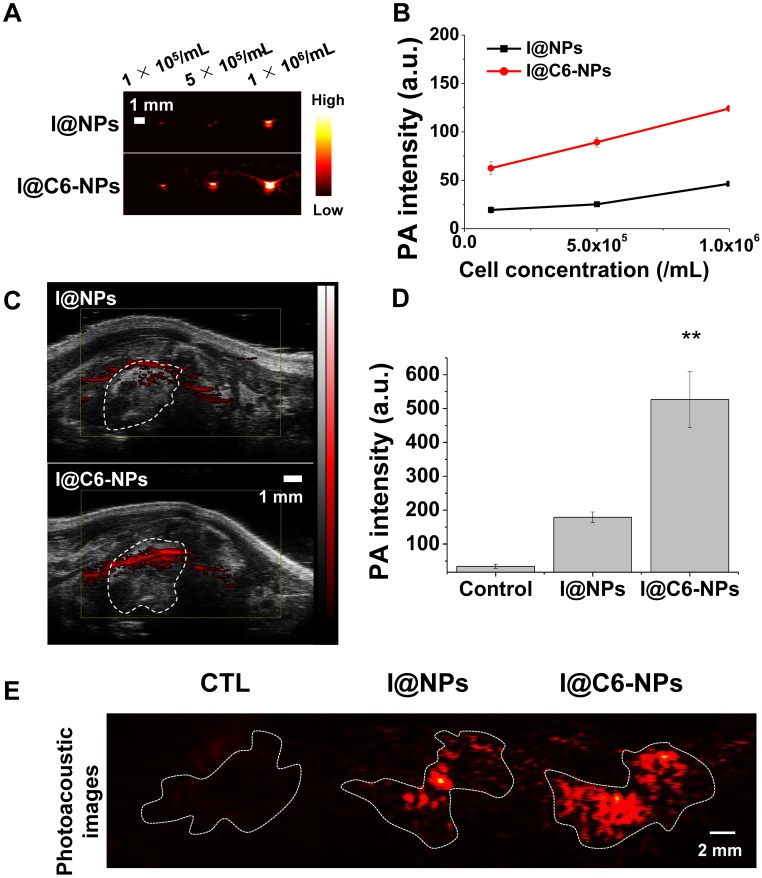
(A-B) In vitro and in vivo photoacoustic contrast ability of I@C6-NPs. Photoacoustic signals from A549 AR cells after 6 h incubation with I@NPs and I@C6-NPs under shaking conditions and the quantification data. L7_4 transducer (focal depth: 3 cm) was used to obtain ex vivo photoacoustic images. (C) In vivo PA images of metastasized lung clearly showed a PA signal was detected when I@C6-NPs were intravenously injected compared to I@NPs. VisualSonics Vevo LAZR-2100 device equipped with a 40-MHz transducer was used to obtain in vivo photoacoustic images. (D) PA signals inside the lung were quantified (ANOVA, p<0.01). (E) Ex vivo PA imaging of extracted lungs 6 h after the injection of I@NPs and I@C6-NPs. L7_4 transducer was used to obtain ex vivo photoacoustic images.

