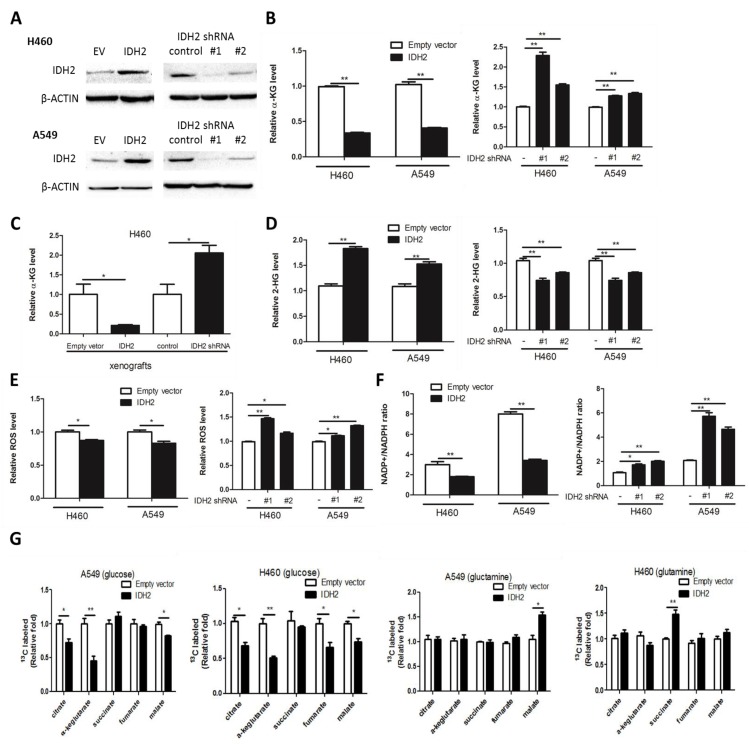
Figure 2.
Wild-type IDH2 controls intracellular concentrations of α-KG, 2-HG and redox status. (A) Western blot showing IDH2 levels in H460 and A549 lung cancer cells overexpressing IDH or expressing knockdown IDH2. β-Actin was used as a loading control. (B-C) Intracellular α-KG levels were determined in H460 and A549 lung cancer cells overexpressing IDH or expressing knockdown IDH2 (B), and in xenograft tissues from mice implanted with H460 cells overexpressing IDH2 or expressing knockdown IDH2 (C). Data are shown as mean values ± S.D. from 3 replicates of each sample, and p values were determined by a two-tailed Student's t test (* p < 0.05; **p < 0.01). (D-F) Intracellular 2-HG levels (D), total ROS levels (E) and the NADP+/NADPH ratio (F) were determined in H460 and A549 lung cancer cells overexpressing IDH2 or expressing knockdown IDH2 (* p < 0.05; **p < 0.01). (G) Carbon-labeled isotopologue TCA cycle metabolites from [U-13C] glucose and [U-13C] glutamine (* p < 0.05; **p < 0.01).

