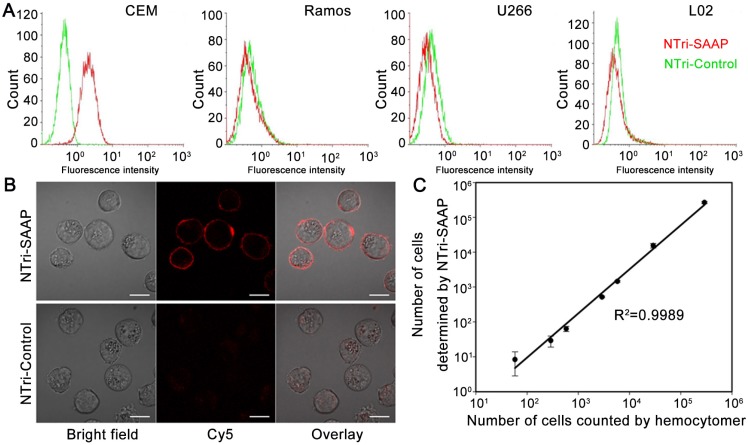
Figure 3.
Specificity and sensitivity investigation of the multivalent NTri-SAAP system. (A) Flow cytometry assays of different cells, incubated with NTri-SAAP or NTri-Control. (B) Confocal microscopy images of CEM cells incubated with NTri-SAAP or NTri-Control, showing the binding of NTri-SAAP on cell membrane surface (scale bar: 10 μm). (C) Calibration curve illustrating the relationship between the amount of CEM cells counted by hemocytometer and the number of CEM cells detected with NTri-SAAP. Error bars represent standard deviations from three repeated experiments.

