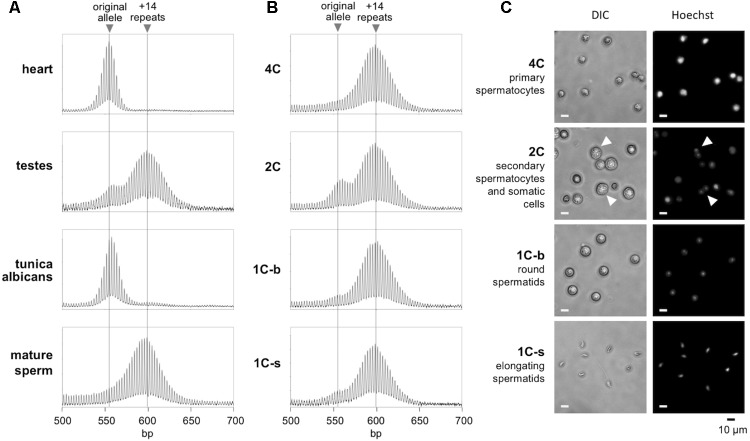
FIGURE 1.
Repeat PCR profiles of different gamete populations in the testes. (A) The repeat PCR profile of heart, testes, tunica albicans, and mature sperm from a 6-month-old male mouse. (B) The repeat PCR profile of different gamete populations purified by flow cytometry from the same animal as described in the “Materials and Methods” section. (C) Morphology of the sorted cell populations. Arrows indicate cells with two distinct nuclei and correspond to secondary spermatocytes just before cytokinesis. Scale bars, 10 μm. 1C-s: small cells with 1C DNA content; 1C-b: big cells with 1C DNA content.

