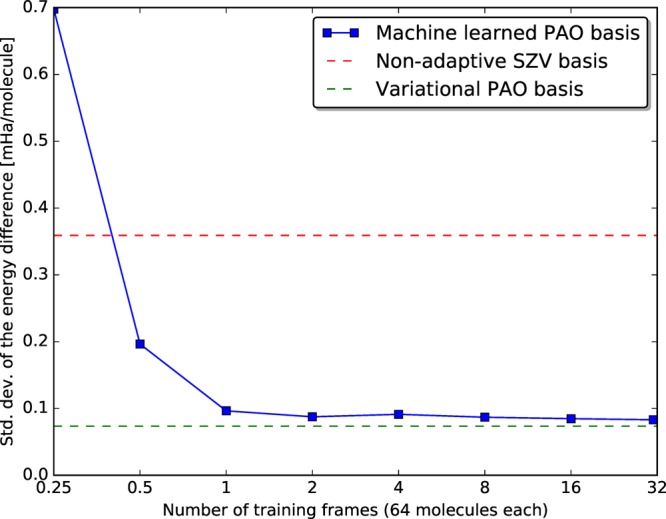
Figure 2.

Learning curve showing the decreasing error of PAO-ML (blue) with increased training set size. For comparison the error of a variationally optimized PAO basis (green) and a traditional minimal SZV-MOLOPT-GTH (red) basis set are shown. With very little training data, the variational limit is approached by the ML method.
