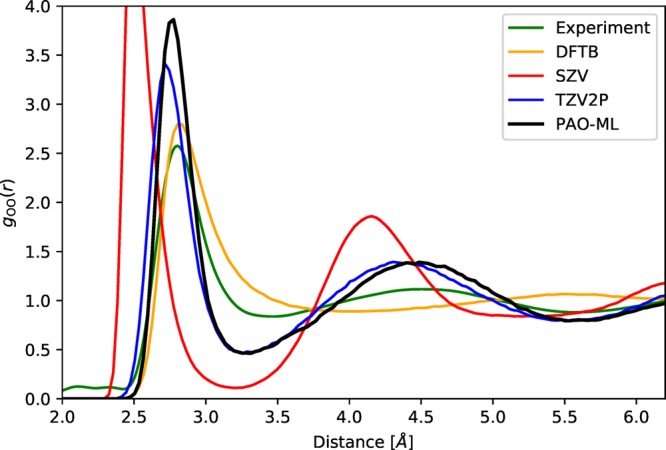
Figure 4.

Shown are oxygen–oxygen pair correlation functions for liquid water at 300 K. As reference the experimental (green, ref (63)) and TZV2P-MOLOPT-GTH basis sets (blue) results are shown. The SZV-MOLOPT-GTH curve (red) and DFTB (orange) are examples of results typically obtained from a minimal basis sets. The adaptive basis set PAO-ML (black) reproduces the reference (TZV2P) better than any of the alternative minimal basis set methods.
