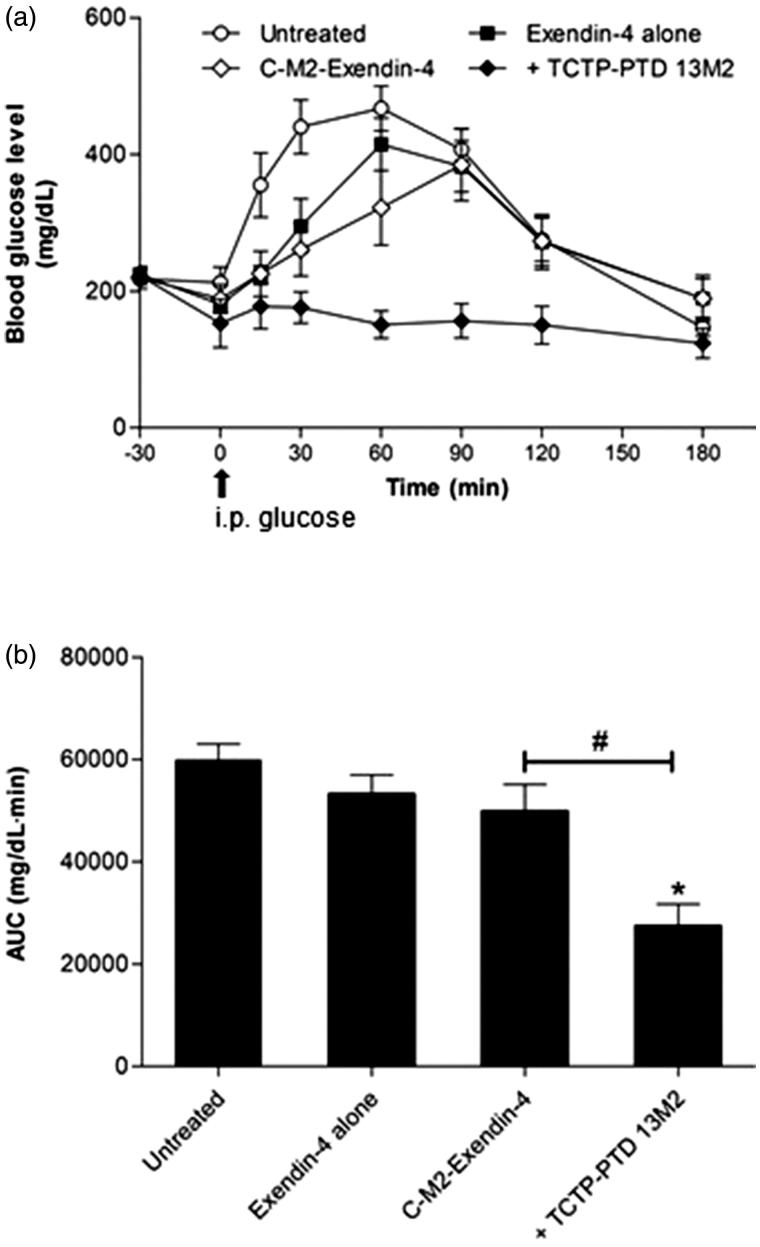
Figure 4.
(a) Changes in blood glucose levels in type 2 db/db mice after nasal administration of exendin-4 alone, exendin-4 plus TCTP-PTD 13M2, and C-M2-Exendin-4 at a dose of 5 μg/kg (equivalent molar dosing). The time of glucose challenge in type 2 db/db mice is marked by the arrow. (b) Changes in the glucose response are expressed as the AUC. Vertical bars indicate means ± SEM (n = 6–8). *p < .05 compared with the exendin-4 alone; #p < .05.

