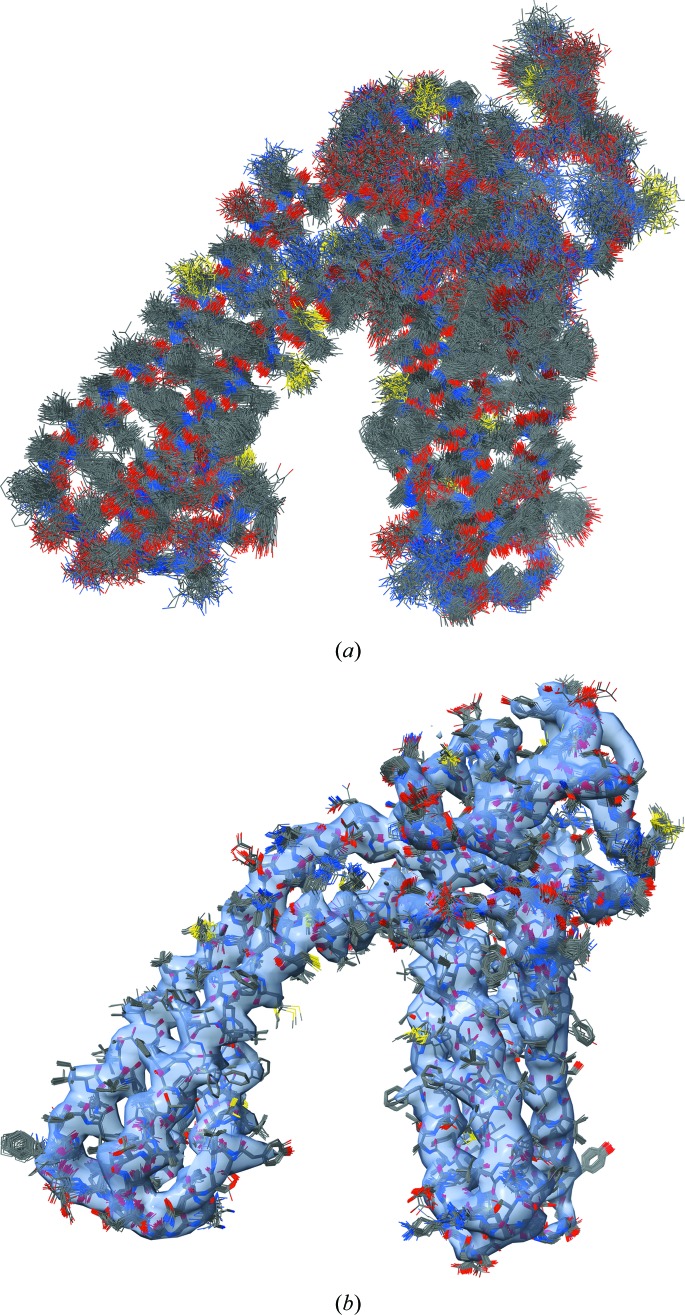
Figure 9.
(a) Ensemble of perturbed 3j5p models; the r.m.s. deviation of each model from the initial model is 3 Å, showing chain A only. (b) Ensemble of refined models in the experimental map. The largest variation is observed in regions that lack density. The images were created using the ChimeraX program (Goddard et al., 2018 ▸).

