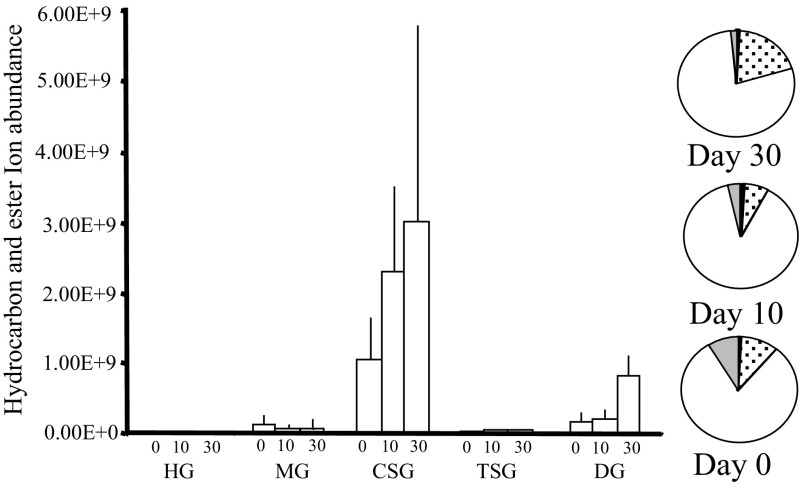
Fig. 2.
The relative amount, based on total ion counts of CHCs and oleic acid wax esters, in the five exocrine glands (HG = hypopharyngeal, MG = mandibular, CSG = cephalic salivary, TSG = thoracic salivary, and DG = Dufour’s gland), at the three different honey bee ages; day 0 = newly emerged, day 10 = nurses, and day 30 = foragers. The error bars represent +1 SD. The pie charts indicate the proportions of the CHC and oleic acid wax esters at each age (CSG = clear, MG = grey, DG = dotted and MG = black)

