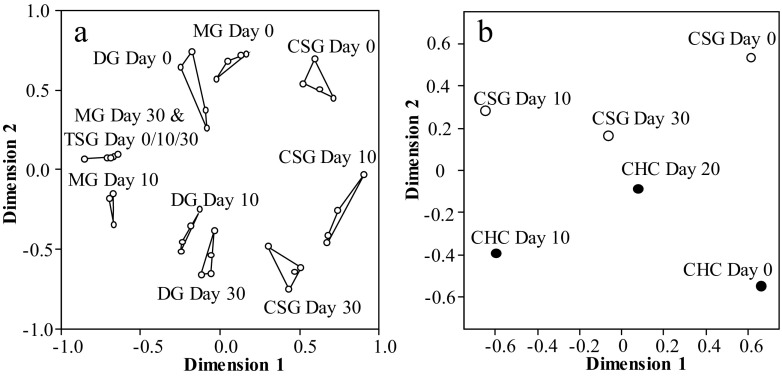
Fig. 3.
a NMDS analysis of the four glands contain different hydrocarbons that change as the bees aged (see Table 1). Each dot represents the mean profile for each colony. b NMDS analysis indicates the similarity between the CSG and CHC profile for each age group (dimension 1). Each dot represents the mean chemical profile (excluding esters) for each group across all samples in each of the four colonies. The Normalized raw stress values were a) 0.05184 and b) 0.01813, indicating good representation of the data

