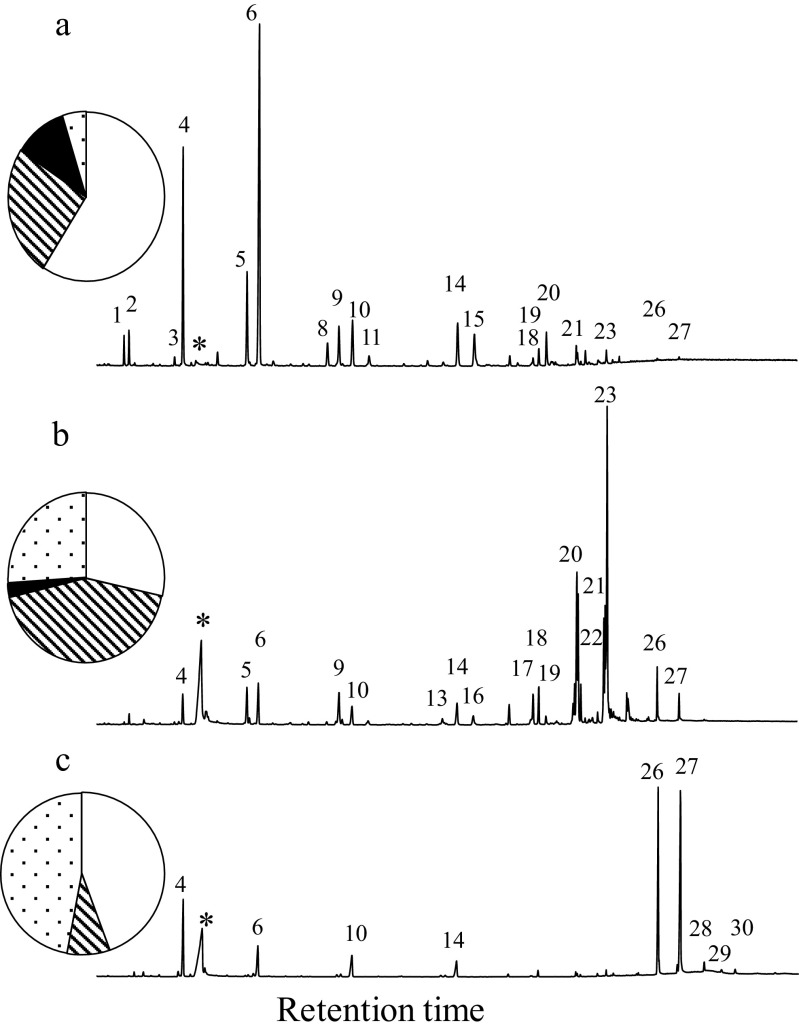
Fig. 4.
Typical Total Ion Chromatograms of the cephalic salivary gland from (a) newly emerged bees, (b) nurse bees, and (c) foragers. The numbers indicate the compounds presented in Table 1. The pie diagrams indicate the proportion of n-alkanes (clear), alkenes (lines), methyl branched-alkanes (black) and oleic acid wax esters (dots). * = Oleic acid (C18)

