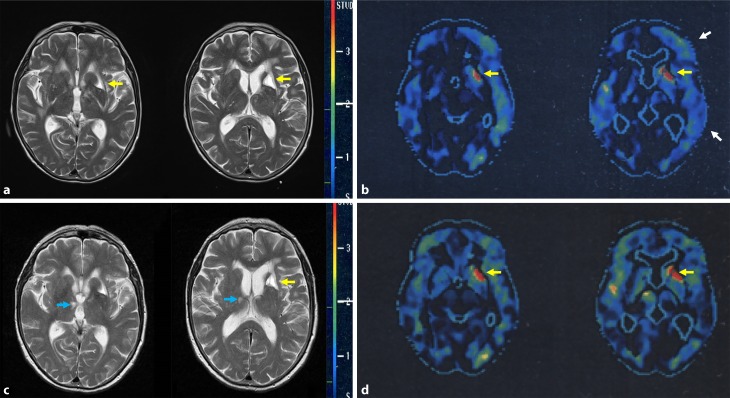
Fig. 4.
Patient 10, neuroimaging. MRI (T2-weighted images) 10 days before (a) and 9.5 months after antibiotic therapy (c). FDG-PET 2 months before (b) and 9.5 months after onset of antibiotic therapy (d). Metabolism evaluated by FDG-PET is presented as comparison with age matched healthy controls. Standard deviation is displayed with a red to dark blue scale. White arrows show hypometabolism in the left frontotemporal region before therapy (b) which is absent after therapy (d). Yellow arrows show left striatal lacunar lesion (a and b), not reversible after therapy (c and d). Blue arrow show small right thalamic vascular lesion (c), not seen in (a)

