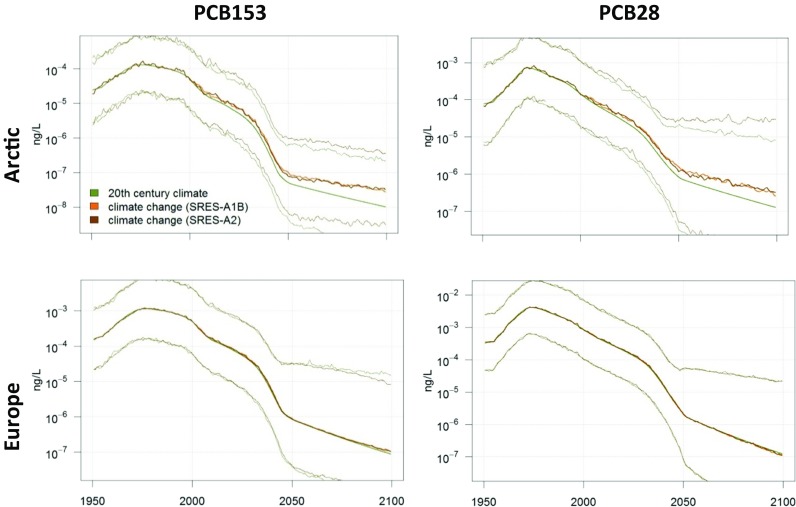
Fig. 11.

Modelled PCB153 (left column) and PCB28 (right column) concentrations in Arctic (upper row) and European (lower row) seawater, with and without climate change. The green middle line represents no climate change while the brown lines indicate what happens with PCB when climate change is taken into account. Uncertainties (95% confidence interval) are indicated for PCB153 with the SRES-A2 scenario by the thinner lines. Please note the figure is reproduced from Wöhrnschimmel et al. (2013)
