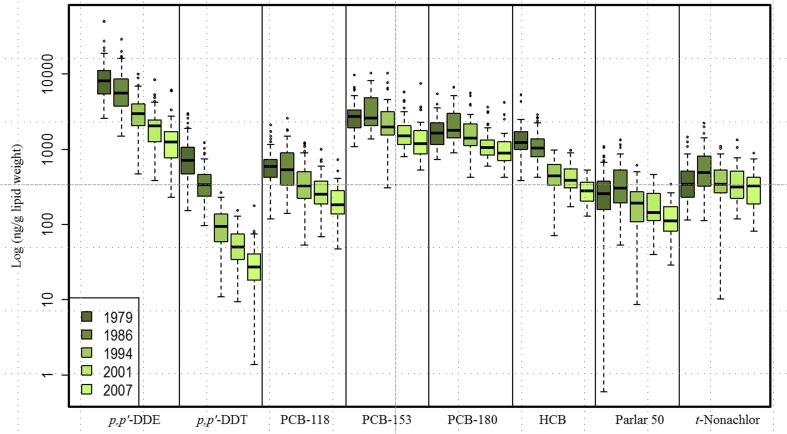
Fig. 21.
Concentrations (ng/g lipid, y-axis: log scale) of selected POPs analysed in repeated serum samples of men (N = 51, 51, 45, 48 and 52 in 1979, 1986, 1994, 2001 and 2007, respectively) from Northern Norway. Parlar 50 represents toxaphenes and t-nonachlor the chlordanes. Boxes extend from the 25th to the 75th percentile, horizontal bars represent the median and whiskers extend 1.5 times the length of the interquartile range (IQR) above and below the 75th and 25th percentiles, respectively; any outliers are represented as points. *p < 0.05 and **p < 0.001 for comparisons between pairs of consecutive sampling years. Please note the figure is reproduced from Nøst et al. (2013)

