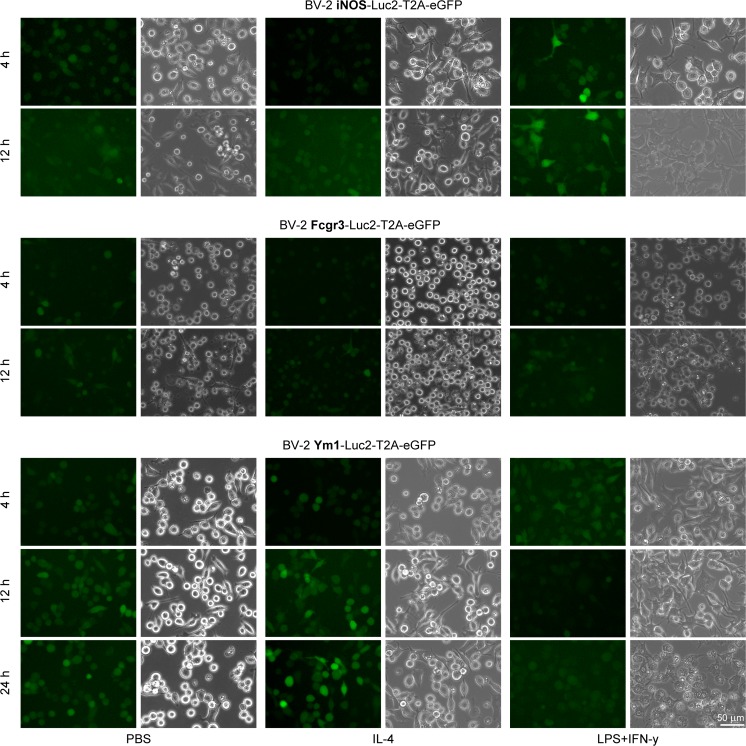
Fig. 3.
eGFP microscopy of stimulated BV-2 cells transduced with the iNOS-, Fcgr3- and Ym1-Luc2-T2A-eGFP constructs. Representative images of transduced cells showing the eGFP channel on the left and the corresponding phase contrast image on the right. eGFP signal increased in BV-2 iNOS cells after 4 and 12 h of LPS + IFN-γ stimulation (top). No eGFP signal change was obvious in BV-2 Fcgr3 cells (centre). In BV-2 Ym1 cells eGFP signal increased after 12 and 24 h of IL-4 stimulation (bottom). 20X magnification

