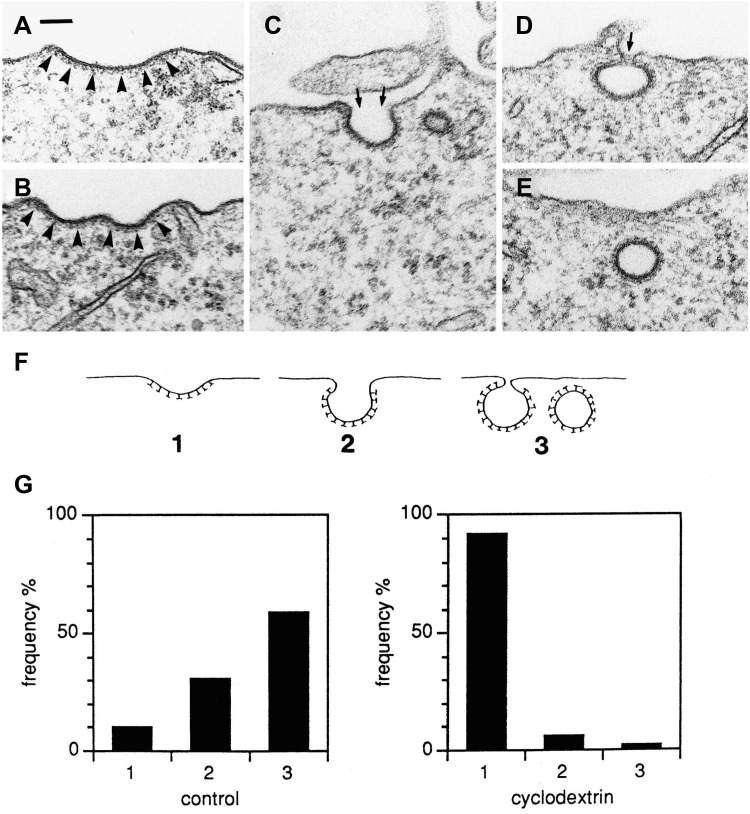
Fig. 3.
Examples from HEp-2 cells of clathrin-coated areas with different extent of invagination (a–e) and schematically drawn in f. In g, clathrin-coats in control cells and cells treated with 10 mM mβCD for 15 min were scored for invagination as classified in f (approximately 200 coated pits in each experiment). The relative frequency of the different types is shown, and reveal that mβCD prevents invagination of clathrin-coated pits. Bar 100 nm. This figure is reproduced from (Rodal et al. 1999). http://www.molbiolcell.org/content/10/4/961.full.pdf+html

