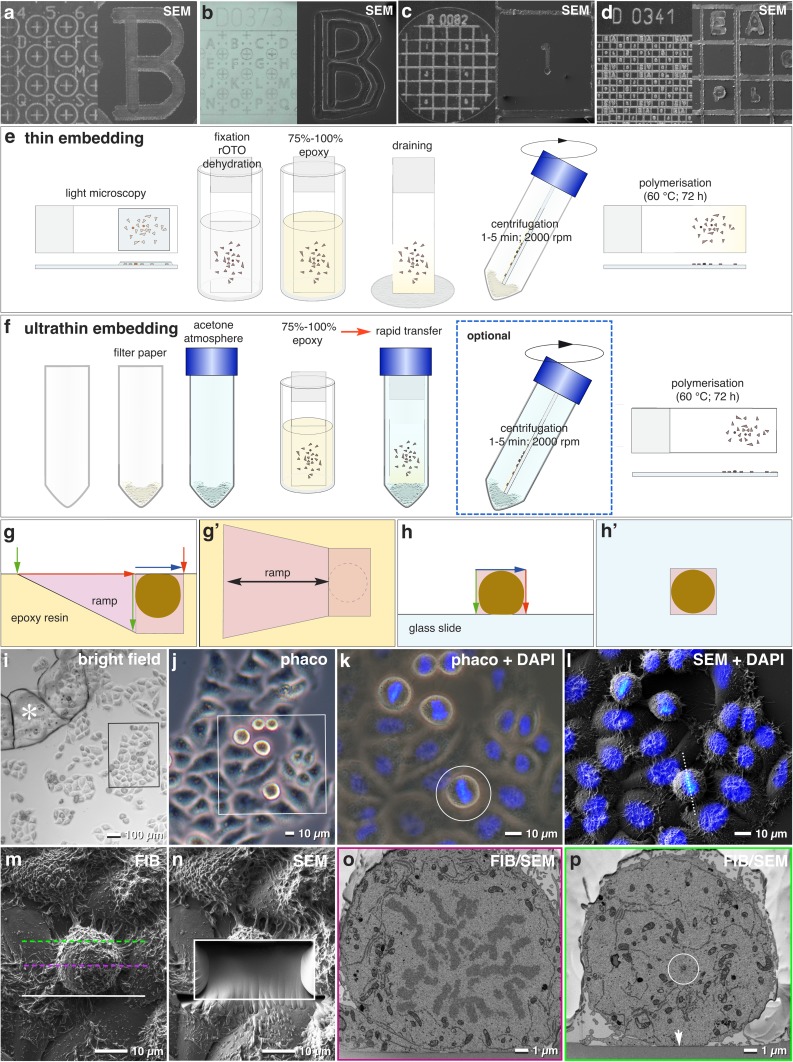
Fig. 1.
Ultra-Thin Embedding of Cells: Precise and Economic CLEM. a–d Close-up photographs of laser marked slides and coverslips with different coordinates and label properties and corresponding SEM micrographs. Labels are seen as indentations in SEM, best suitable for ultra-thin embedding (a, b). For thin embedding, raised labels are of advantage for better visualization in SEM (c, d). e, f Workflow for thin (e) and ultra-thin (f) embedding. For thin embedding, a simple draining of epoxy resin in concentrations from 75 to 100% can be adequate for larger cells/objects. After centrifugation, the epoxy layer is significantly reduced, but a slight gradient in thickness at the lower part of the slide is typical (e). For ultra-thin embedding, a filter paper, saturated with acetone, is inserted at the bottom of a Falcon® tube to provide an acetone atmosphere, which prohibits increase of resin viscosity, occurring within seconds to few minutes. Simple draining in an upright position results in a very thin resin layer. After centrifugation, the resin layer is extremely thin, surface details of cells appear to be uncovered (f). g, h Comparison of FIB/SEM milling of a conventionally embedded cell within a resin block, which requires a deep ramp (g = side view; g’ = top view) or ultra-thin embedded on a laser marked slide (h). As a deep ramp is needless, milling and block face imaging can start directly at the cell (h = side view; h’ = top view). The volume that has to be milled (pink) for an entire data set of a cell is reduced to 10% (h, h’). i Bright field light micrograph of HeLa cells, grown on slide with laser marks (asterisk) serving as coordinates to retrieve target cells in the SEM (framed area). Scale bar 100 µm. j Phase contrast micrograph of the target region from (i). Dividing cells are spherical and appear bright (framed area). Scale bar 10 µm. k Merged DAPI fluorescence and phase contrast micrographs (framed area of j) shows mitotic stages and a target cell (circle) with upright orientation of the metaphase plate. Scale bar 10 µm. l Merged SEM and DAPI micrographs of the target area. After ultra-thin embedding in epoxy resin, the target cell is precisely relocated. The axis of the metaphase plate is in upright position (dotted line). Scale bar 10 µm. m SEM micrograph of the target cell (FIB image), oriented for FIB/SEM milling parallel to the metaphase plate. White line = starting position for milling; magenta line = position of metaphase plate; green line = expected position of the distal centrosome. Scale bar 10 µm. n SEM micrograph of the target area shown in (m) after FIB/SEM milling (framed area). Image acquisition started direct in front of the cell and stopped just after reaching the desired depth. Scale bar 10 µm. o, p Selected SEM micrographs from the FIB/SEM-tomogram (magenta and green dotted line in (m), illustrating the position of the images shown in (o) and (p). 1100 micrographs cover the entire metaphase plate including the centrosomes (circle). Arrow indicates the reference line (slide) for precise alignment. Scale bar 1 µm

