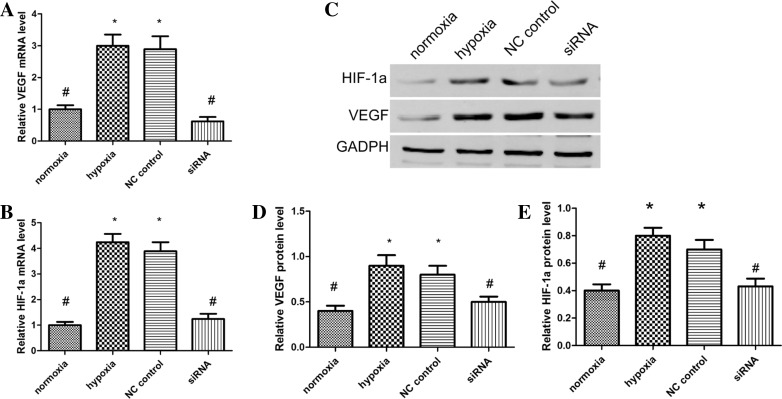
Fig. 3.
Changes in HIF-1α and VEGF mRNA levels in each group as measured by quantitative PCR (a, b). Protein expression of HIF-1α and VEGF in differentially treated HTR8/SVneo cells as measured by western blot analyst (c). Protein expression relative to GAPDH of HIF-1α ratio (d), and VEGF ratio (e); Values are means mean ± standard deviation (n = 3 for each group). Negative control siRNA as NC control. *P < 0.05 vs. normoxic group; #P < 0.05 vs hypoxic group

