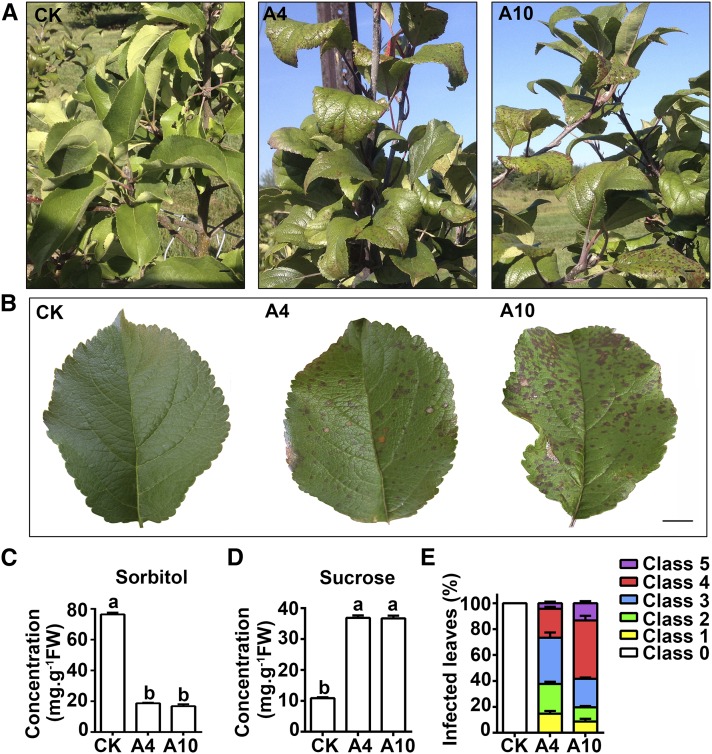
Figure 1.
Leaf Symptoms and Carbohydrate Levels of the Wild-Type Control and Antisense A6PR Lines of ‘Greensleeves’ Apple.
(A) and (B) Leaf spot-like symptoms on the leaves of antisense lines A4 and A10 late in the season in contrast to no symptoms on the wild-type control (CK). Bars = 1 cm.
(C) and (D) Concentrations of sorbitol and sucrose in the leaves of CK, A4, and A10 measured via gas chromatography-mass spectrometry. Different letters (a and b) indicate significant differences (P < 0.05) between genotypes using Duncan’s multiple range test (MRT) after ANOVA. FW, fresh weight.
(E) Percentage of leaves showing various degrees of severity of the symptoms (% leaf area with symptoms). Class 0, no symptoms; class 1, <5%; class 2, 5 to 15%; class 3, 15 to 25%; class 4, 25 to 35%; and class 5, >35%. Data are mean ± sd of five biological replicates with six leaves pooled from two trees per replicate for sugar analysis or 50 leaves pooled from two trees per replicate for disease evaluation.

