Figure 2.
Nuclear Positioning Defects Observed in KCH KO Cells.
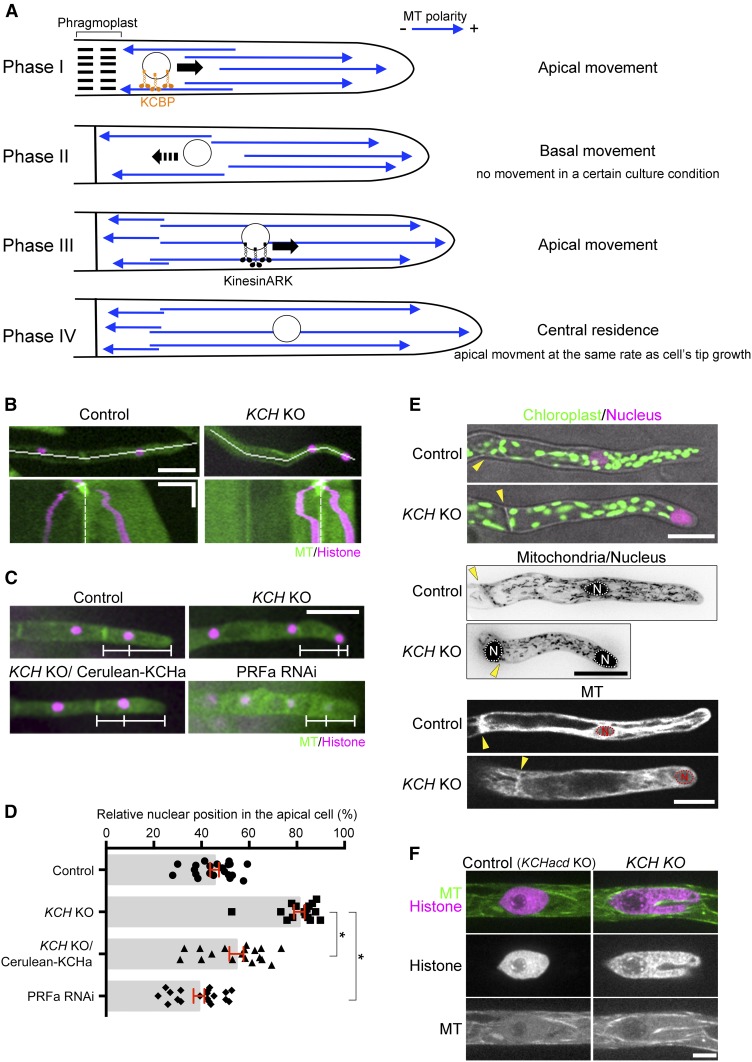
(A) Schematic representation of MT polarity and nuclear positioning in apical cells based on previous studies (Hiwatashi et al., 2014; Miki et al., 2015; Yamada et al., 2017).
(B) Nuclear migration defects were observed in the KCH KO line. Snapshot (top) and kymograph (bottom) of a control and KCH KO cell are displayed. White lines in snapshots indicate the position where the kymograph was created. Kymograph starts from the mitotic metaphase. White broken lines indicate the position of the cell wall. Horizontal bar = 50 µm; vertical bar = 2 h.
(C) Nuclei were apically localized in the absence of KCH, and the defect was rescued by Cerulean-KCHa expression. White bars indicate positions of the cell wall, nucleus, and apical tip. Bar = 50 µm.
(D) Relative position of the nucleus within the apical cell was quantified. The “0” corresponds to the cell wall, whereas “100” indicates the cell tip. Bars and error bars represent the mean and se, respectively. Control, n = 21, KCH KO, n = 16; KCH KO/Cerulean-KCHa, n = 18; PRFa RNAi, n = 19. *P < 0.0001 (unpaired t test with equal sd, two-tailed). Experiments and data analyses were performed twice, with data from one experiment displayed.
(E) Distribution of nuclei, chloroplasts, mitochondria, and vacuoles (GFP-tubulin-excluded area). Yellow arrowhead and “N” indicate the position of the cell wall and nucleus, respectively. Mitochondrial images were acquired with six z-sections (separated by 4 μm) and are displayed after maximum projection. Bars = 25 µm.
(F) Nuclear deformation in the apical cell. Triple KO line (KCHacd KO) was used as control. Bar = 5 µm.

