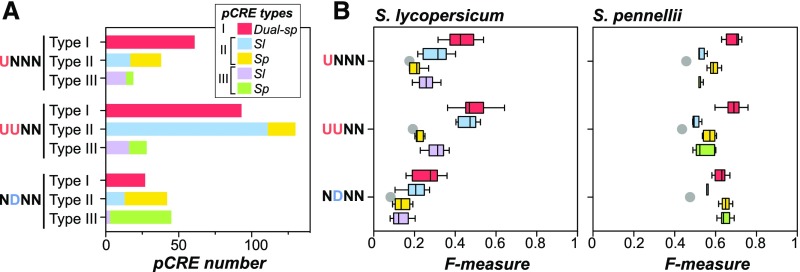
Figure 7.
Performance of the Type I, II, and III pCREs in Predicting Wound Response.
(A) Numbers of pCREs that were consistently enriched in both species and belong to a dual-species subgroup (red, Type I), belong to “dual-species” subgroup but were specifically enriched in S. lycopersicum (blue, Type II from Sl) or in S. pennellii (orange, Type II from Sp), and belong to “single-species” subgroup and were specifically enriched in S. lycopersicum (purple, Type III from Sl) or in S. pennellii (green, Type III from Sp) in three example wound response clusters.
(B) Box plot showing the wound response prediction performance (F-measure) based on a model using the pCRE sets in (A). For each wound response cluster, 10 F-measures were calculated from 10-fold cross validation and shown as a box plot. Gray dot: the average F-measure of 10,000 random predictions indicating the performance of a meaningless model.

