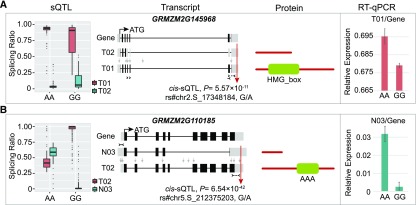
Figure 4.
Examples of sQTL-Affected Isoforms Displaying Different Protein Domains.
Box plots display splicing ratio change at different genotypes of sQTL SNPs. For the transcript model, UTRs are shown in gray boxes on the two sides, and CDSs are shown in black boxes in the middle. Lines indicate introns. Transcripts named “T” and “N” stand for known and newly assembled transcript, respectively. Red arrow indicates the position of cis-sQTL SNP, and gray arrows indicate the position of other less significant SNPs. The positions of primers used for RT-qPCR were indicated by dotted lines with arrows. For the protein model, the conserved domain between different isoforms is indicated in green. The RT-qPCR results are shown on the right. For each genotype at the sQTL, four inbred lines were randomly selected from the maize association panel for the RT-qPCR assay of kernels at 15 DAP. Values represent the mean ± sd of the measurements (n = 4).
(A) Significant cis-sQTL detected at GRMZM2G145968 that involved differential use of two isoforms differing in an HMG_box domain. AA and GG represent the two genotype groups at sQTL SNP rs#chr2.S_17348184.
(B) Significant cis-sQTL detected at GRMZM2G110185 that involved differential use of two isoforms differing by an AAA domain. AA and GG represent the two genotype groups at sQTL SNP rs#chr5.S_212375203.

