Figure 5.
AS-Coupled PEPi.
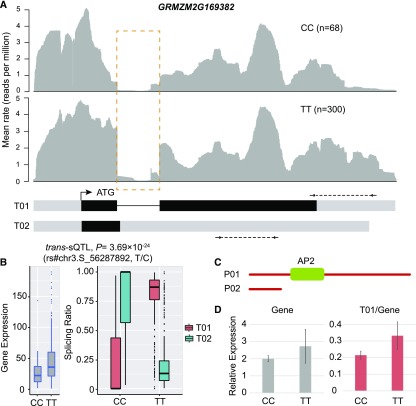
(A) An example of the AS-coupled PEPi mechanism. GRMZM2G169382 was detected with a significant trans-sQTL. For the transcript model, UTRs are shown in gray boxes on the two sides, and CDSs are shown in black boxes in the middle. Lines indicate introns. Transcripts named “T” stand for known transcript. The positions of primers used for RT-qPCR were indicated by dotted lines with arrows. For the upper panel, the average rate at each base on the gene is plotted, where individuals were stratified according to their genotype at sQTL SNP rs#chr3.S_56287892. Brown dotted box shows where transcript structures differ.
(B) The box plot shows the difference in splicing ratio and overall gene expression level between genotypes (CC and TT) at sQTL SNP rs#chr3.S_56287892.
(C) Structure of P02, showing it has lost the whole DNA binding domain relative to P01.
(D) RT-qPCR results. For each genotype at the sQTL, four inbred lines were randomly selected from the maize association panel for the RT-qPCR assay of kernels at 15 DAP. Values represent the mean ± sd of the measurements (n = 4).

