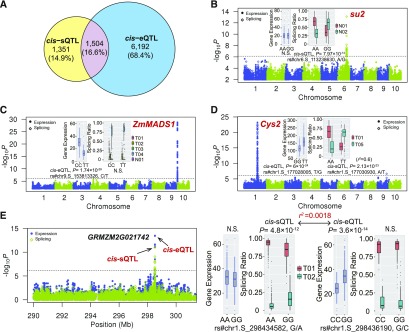
Figure 8.
Relatively Independent Genetic Control of sQTLs and eQTLs.
(A) Venn diagram showing the overlap between sQTLs and eQTLs. From (B) to (E), Manhattan plots show GWAS results for splicing ratios and overall expression levels for each gene. Transcripts named “T” and “N” stand for known and newly assembled transcript, respectively.
(B) An example of a gene (su2) with only cis-sQTLs detected without affecting the expression level. Box plots display splicing ratio change at different genotypes (AA and GG) of sQTL SNP rs#chr6.S_113238630.
(C) An example of a gene (ZmMADS1) with only cis-eQTLs detected without affecting the splicing. Box plots display total mRNA level change at different genotypes (CC and TT) of eQTL SNP rs#chr9.S_153813326.
(D) An example of a gene (Cys2) with detected variants affecting both AS and total mRNA level. Box plots display splicing ratio change at different genotypes (AA and TT) of sQTL SNP rs#chr1.S_177030930 and total mRNA level change at different genotypes (GG and TT) of eQTL SNP rs#chr1.S_177028005.
(E) Independent cis-regulation of AS and total mRNA level. Both cis-sQTLs and cis-eQTLs were detected at GRMZM2G021742, but the two SNPs were not in LD (r2 =0.0018). Box plots display splicing ratio change at different genotypes (AA and GG) of sQTL SNP rs#chr1.S_298434582 and total mRNA level change at different genotypes (CC and GG) of eQTL SNP rs#chr1.S_298436190.

