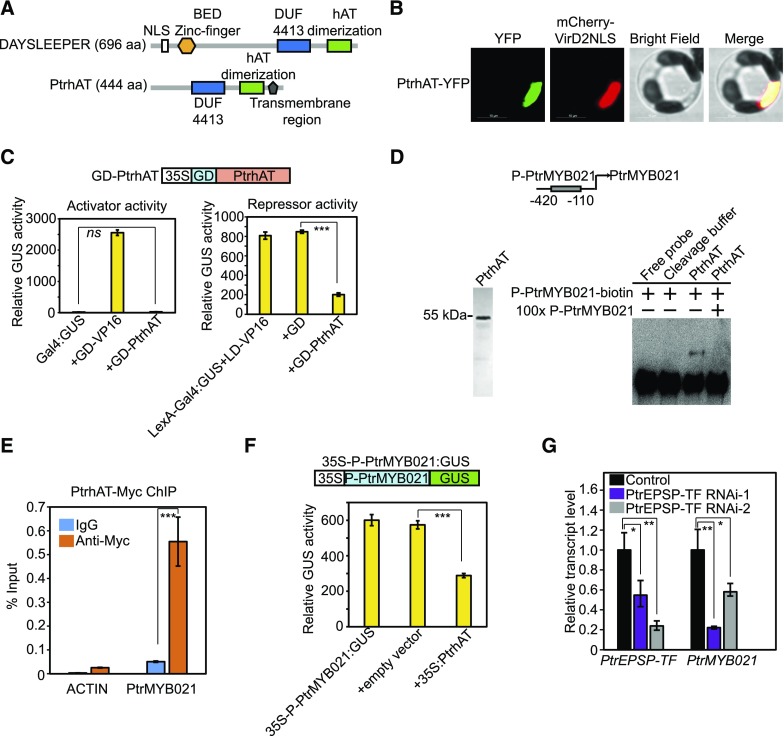
Figure 4.
PtrhAT Directly Targets PtrMYB021.
(A) Comparison of protein domains and motifs between Populus PtrhAT and Arabidopsis DAYSLEEPER.
(B) Nuclear localization of PtrhAT in Populus protoplasts. PtrhAT-YFP (green) was transiently expressed in Populus protoplasts. MCherry-VirD2NLS (red) was cotransfected to indicate nucleus localization. Bar = 10 µm.
(C) PtrhAT has repressor but not activator activity. Transcriptional activity of PtrhAT was analyzed in a similar protoplast transient expression system as the analyses on PtrEPSP-TF. 35S:Luciferase was cotransfected with reporters and effectors and Luciferase activity was used to normalize and calculate the relative GUS activity. All transfection assays were performed in triplicate to calculate the mean value and sd (error bar), which were used in Student’s t tests.
(D) EMSA. Left: Purified PtrhAT protein. GST-PtrhAT was expressed and purified in E. coli. The GST tag was subsequently cleaved off using PreScission Protease. Right: PtrhAT directly binds to the PtrMYB021 promoter in vitro. Cleavage buffer was used as the negative control in EMSA. 100× unlabeled DNAs with the same sequence of biotin-labeled PtrMYB021 promoter region were used for the competition assay.
(E) µChIP shows in vivo association of PtrhAT and the PtrMYB021 promoter. Reactions with IgG were used as negative controls. The promoter region of PtACTIN was amplified to indicate the specificity of ChIP. Means and standard derivations (error bars) of three technical repeats are presented. µChIP was performed at least three times.
(F) PtrhAT represses the activity of the PtrMYB021 promoter. PtrMYB021 promoter (−420 to −110 nucleotides from the start codon) was inserted between the 35S promoter and GUS reporter and then cotransfected with vectors overexpressing PtrhAT. Blank vector was used as negative control. All transfection assays were performed in triplicate to calculate the mean value and sd (error bar), which were used in Student’s t tests.
(G) RT-qPCR analysis of transcript levels of PtrEPSP-TF and PtrMYB021 in two Populus PtrEPSP-TF RNAi lines (PtrEPSP-TF RNAi-1 and PtrEPSP-TF RNAi-2). RT-qPCR analysis was performed in triplicate to calculate the mean value and sd (error bar), which were used in Student’s t tests.
P value comparisons of (C) and (E) to (G) were calculated using two-tailed Student’s t tests (***P < 0.001, **P < 0.01, *P < 0.05, and ns P > 0.05).

