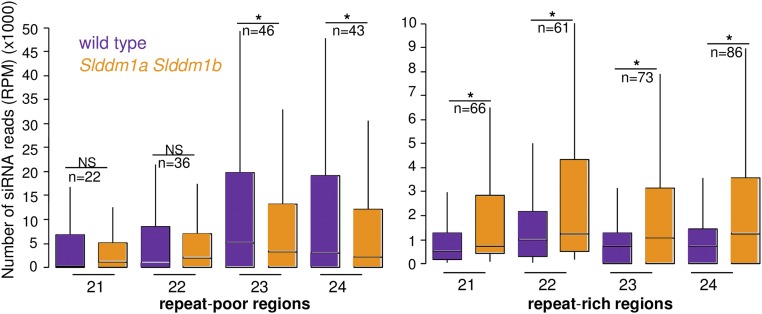
Figure 7.
siRNA Content in Repeat-Rich and Repeat-Poor Regions of the Slddm1a Slddm1b Mutant and the Wild Type.
Box plots showing average numbers of 21- to 24-nucleotide reads contained within repeat-rich and repeat-poor regions (n) having a significant number of reads (DESeq2 cutoff of 0.01). The numbers of reads were normalized to the total number of mapped reads. Asterisks indicate significant differences and NS indicates nonsignificant differences (Mann-Whitney U-test, P < 0.01).

