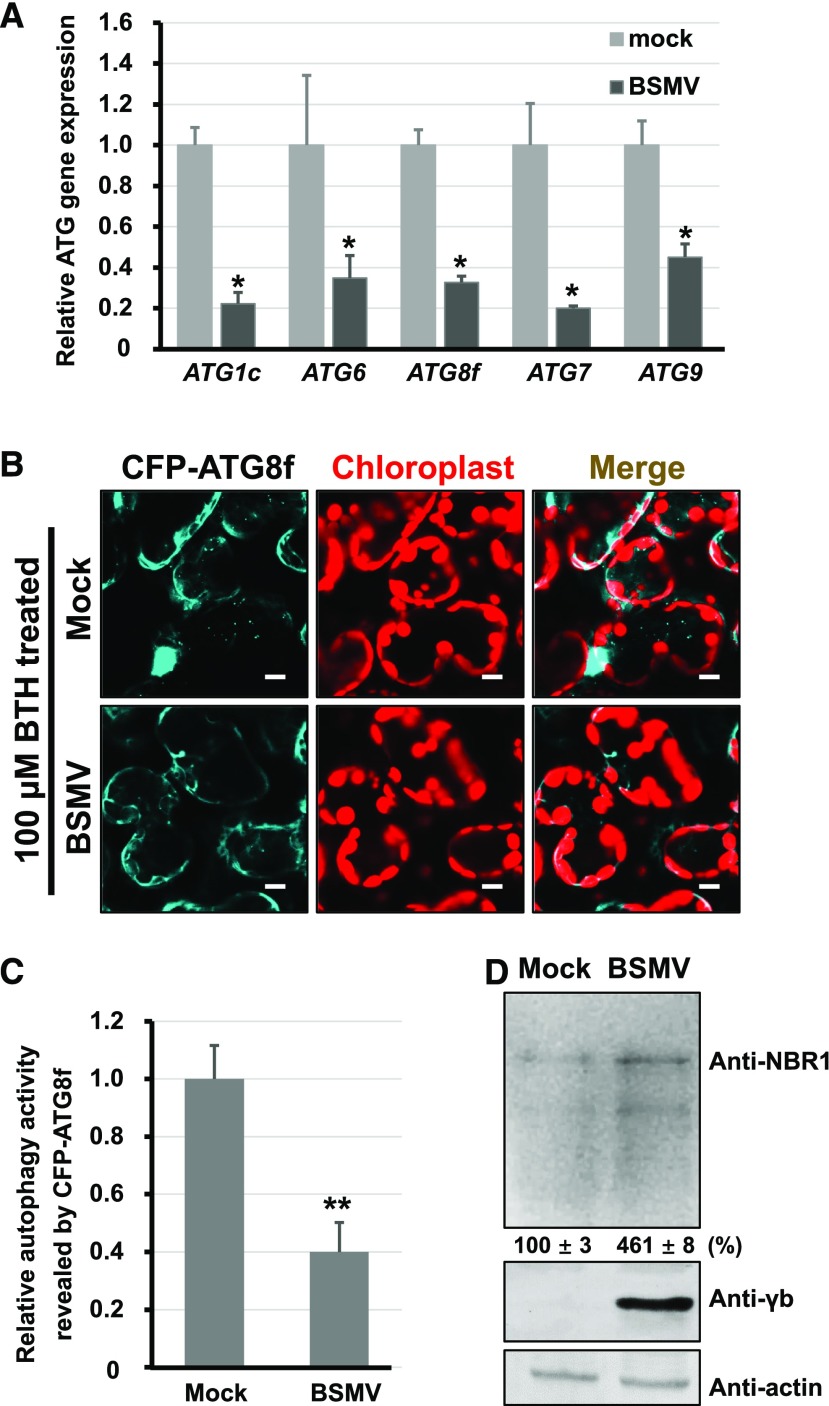
Figure 2.
BSMV Infection Inhibits Autophagy.
(A) qRT-PCR analysis of the transcript levels of ATG1c, ATG6, ATG8f, ATG7, and ATG9 in mock- and BSMV-infected N. benthamiana. The housekeeping gene PP2A served as the internal control. The data are presented as the relative ratio of gene expression compared with the control (mock), which was set to 1.0. Error bars represent se of the mean (n = 3). The asterisks indicate significant difference by Student’s t test (*P < 0.05) compared with the control.
(B) Relative autophagic activity revealed by CFP-ATG8f in mock- or BSMV-infected leaves treated with 100 μM BTH. Numerous CFP-ATG8f-labeled positive autophagic bodies in vacuoles were observed in mock-inoculated plants, but not in BSMV-infected leaves. Autofluorescence of chloroplasts is pseudocolored in red. Bars = 10 μm.
(C) Relative autophagy activity revealed by the autophagy marker CFP-ATG8f in BSMV-infected leaves was normalized to that of mock-inoculated leaves. Quantification of CFP-ATG8f-labeled autophagic puncta per cell was performed by counting the autophagic bodies. More than 200 cells per treatment were used for quantification. Error bars indicate se from three individual experiments. The asterisks indicate significant differences by Student’s t test (**P < 0.01) compared with mock inoculation.
(D) Protein gel blot analysis of autophagy flux probed with anti-NBR1 antibodies in mock- and BSMV-infected N. benthamiana leaves. Error bars indicate sd of the mean.

