Figure 3.
BSMV γb Protein Suppresses Autophagy.
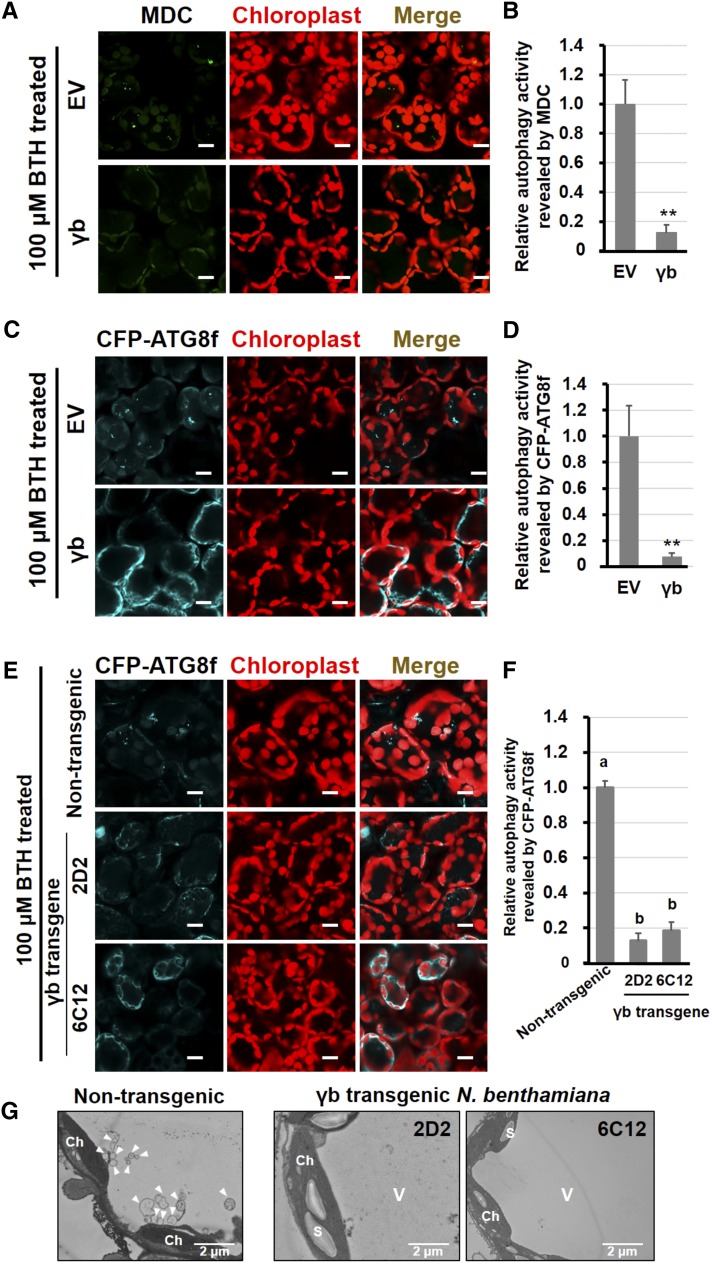
(A) and (C) Representative images of autophagic activity revealed by MDC-staining (A) and the autophagy marker CFP-ATG8f (C) in cells transiently expressing γb (lower panel) or agroinfiltrated with EV (upper panel) after 100 μM BTH treatment. CFP-ATG8f-labeled autophagic bodies and autophagosomes are shown in cyan, and MDC-stained structures and autofluorescence from chloroplasts are pseudocolored in green and red, respectively. Bars = 20 μm.
(B) and (D) Quantification of the autophagy activity shown in (A) and (C) in cells. The autophagy activity in EV-agroinfiltrated leaves was set to 1.0. More than 200 mesophyll cells were analyzed per treatment. Error bars indicate se from three independent experiments. Statistical significance was determined by Student’s t test (**P < 0.01).
(E) Confocal analysis of autophagic activity revealed by the autophagic marker CFP-ATG8f in γb-transgenic (lower panel) and nontransgenic N. benthamiana (upper panel) after 100 μM BTH treatment. Autophagosomes and autophagic bodies are shown by CFP fluorescence, and chloroplasts are shown in red. Bars = 20 μm.
(F) Quantification of the autophagy activity shown in (E). The autophagy activity in nontransgenic plants was set to 1.0. More than 200 mesophyll cells were analyzed per treatment. Error bars indicate se. Statistical significance was determined by Student’s t test (P < 0.05).
(G) TEM analysis of γb or nontransgenic N. benthamiana after 100 μM BTH treatment.

