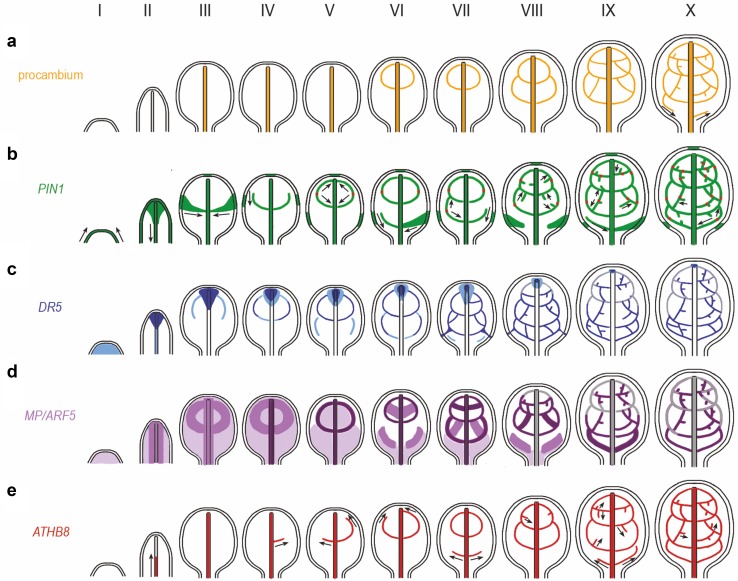
Fig. 2.
Changes in the pattern of gene expression during procambium development in the first leaf of Arabidopsis. a Procambium development; black arrows show the directions of procambium emergence; b PIN1; black arrows indicate the direction of PIN1 protein polarity in the plasma membrane; red dots indicate cells with bipolar PIN1 localization; green regions in the epidermis represent auxin convergence points; c DR5 auxin-responsive promoter; the darker blue color shows a stronger DR5 expression; d MP; the darker violet color shows a stronger MP gene expression; e ATHB8; black arrows indicate the direction of its progressive appearance; I–X, successive stages of the venation development

