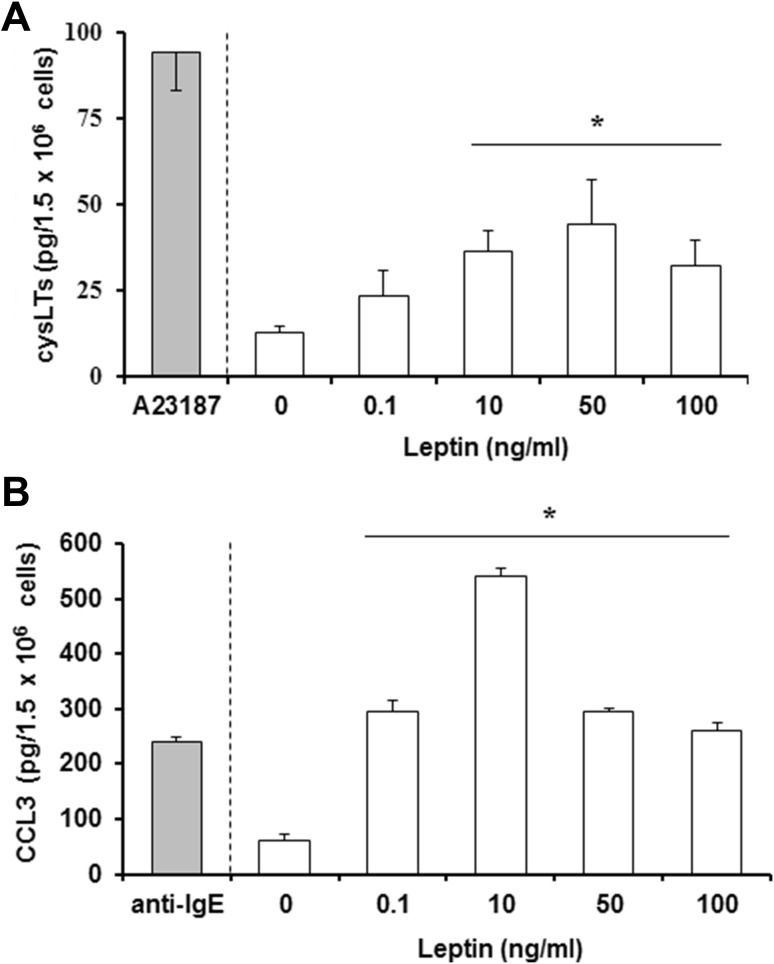
Fig. 2.
CysLTs and chemokine CCL3 released by mast cells following exposure to leptin. Mast cells were incubated with leptin at different concentrations, calcium ionophore A23187 at 5 µg/ml or anti-IgE at 5 µg/ml (positive controls), or medium alone and levels of cysLTs (a) or CCL3 (b) were measured in supernatants by ELISA. Results are the mean ± SD of four independent experiments done in duplicate. *P < 0.05

