Fig. 4.
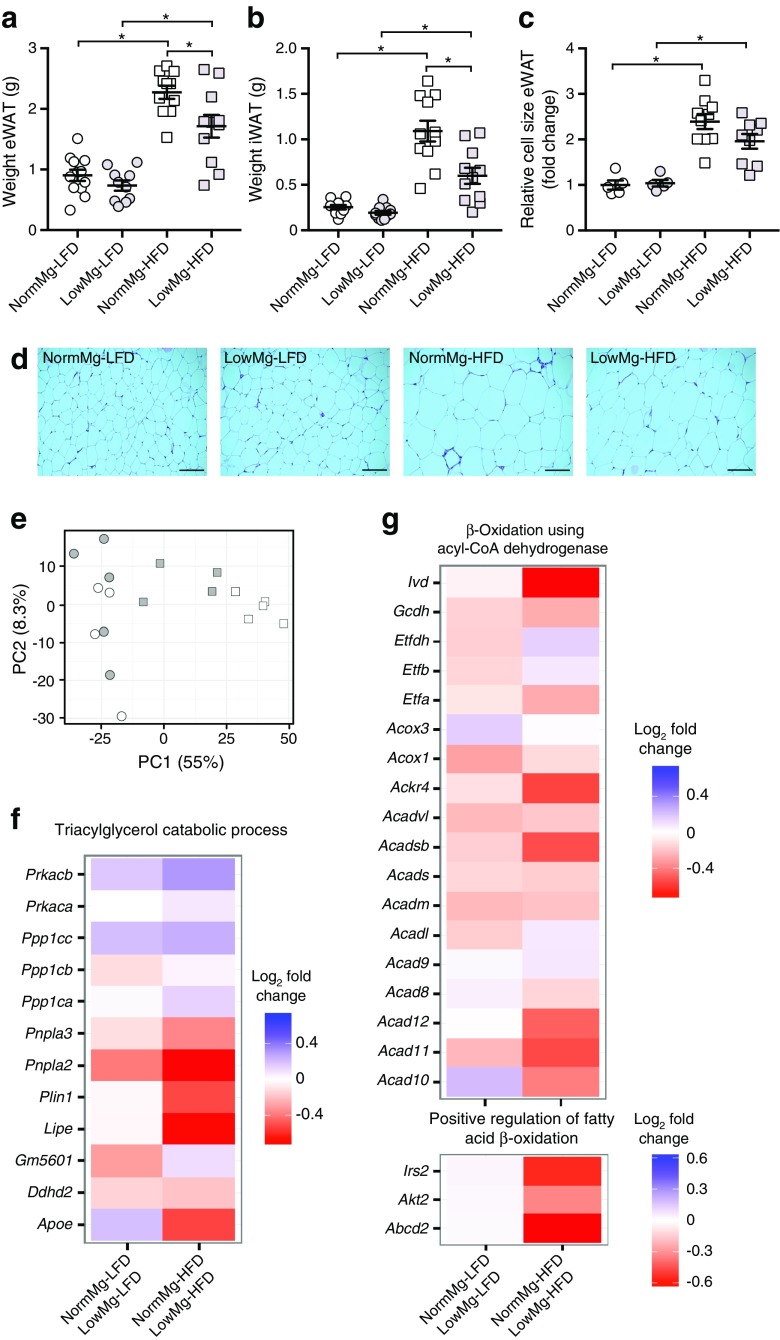
Reduced adipose tissue mass in Mg2+-deficient HFD-fed mice is associated with increased mRNA expression of lipolysis genes in eWAT. Weight of (a) eWAT, (b) iWAT and (c) eWAT cell size at death (17 weeks, n = 12 mice per group, n = 11 mice for the LowMg-HFD group). NormMg-LFD (white circles), LowMg-LFD (grey circles), NormMg-HFD (white squares), LowMg-HFD (grey squares). Data are mean ± SEM. Depending on the absence or presence of a significant interaction effect between dietary fat and Mg2+ content, either a two-way ANOVA (Tukey’s multiple comparison test) or an unpaired multiple t test (Holm–Sidak multiple comparison test) approach was used, respectively, to determine statistical significance. (d) Representative images of H&E stained eWAT. Scale bars, 100 μm. (e) Principal component (PC) analysis of RNA sequencing on eWAT. NormMg-LFD (white circles, n = 4), LowMg-LFD (grey circles, n = 5), NormMg-HFD (white squares, n = 5), LowMg-HFD (grey squares, n = 4). The percentages on the x-axis and y-axis indicate the total percentage of variance explained by the first two principal components, respectively. GO term analyses of the pathways (f) ‘triacylglycerol catabolic process’ and (g) ‘β-oxidation using acyl-CoA dehydrogenase’; and ‘positive regulation of fatty acid β-oxidation’. Gene expression changes are presented as log2 fold change with the NormMg2+ diet as reference, so that a negative value (in red) indicates a decrease in expression in the NormMg2+ vs LowMg2+ groups. *p < 0.05 for the comparisons shown

