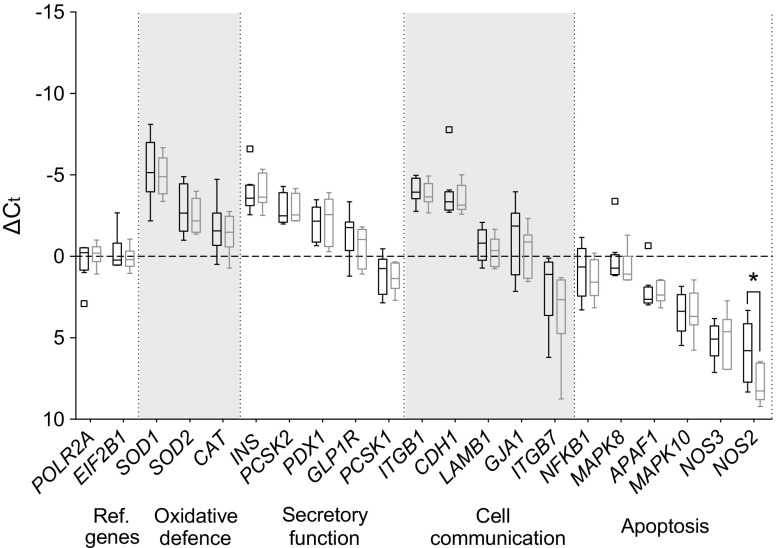
Fig. 3.
qRT-PCR was performed to identify differences between the gene expression profiles (in four categories, with alternate grey and white shading) of native islets (n = 8) and P750 CFA-PI (n = 7) 48 h after aggregation. Results were normalised to the reference (Ref.) genes POLR2A and EIF2B1 and are presented as ΔCt values to allow comparison between native islets (black) and CFA-PI (grey) on a gene-by-gene basis. Data are plotted in Tukey box-and-whisker format, where the boxes indicate the interquartile range, with an internal horizontal line indicating the median. Outliers (defined as points outside 3/2 the interquartile range) are plotted individually, and the ‘whisker’ lines indicate data range from minimum to maximum excluding outliers. A reduction in NOS2 gene expression in CFA-PI was the only statistically significant difference observed (*p < 0.05). Data were compared by Mann–Whitney U test between groups within each gene

