Fig. 2.

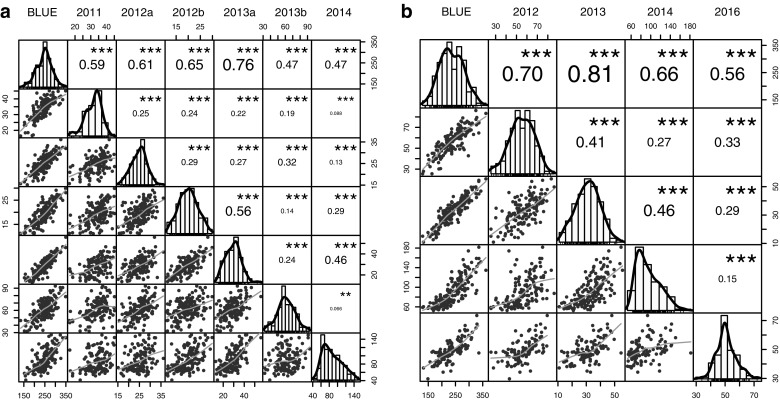
Pearson correlation matrix of powdery mildew area under the disease progression curve phenotype data for the strawberry mapping populations. a ‘Emily’ × ‘Fenella’ and b ‘Redgauntlet’ × ‘Hapil’. Numbers are R2 values

Pearson correlation matrix of powdery mildew area under the disease progression curve phenotype data for the strawberry mapping populations. a ‘Emily’ × ‘Fenella’ and b ‘Redgauntlet’ × ‘Hapil’. Numbers are R2 values