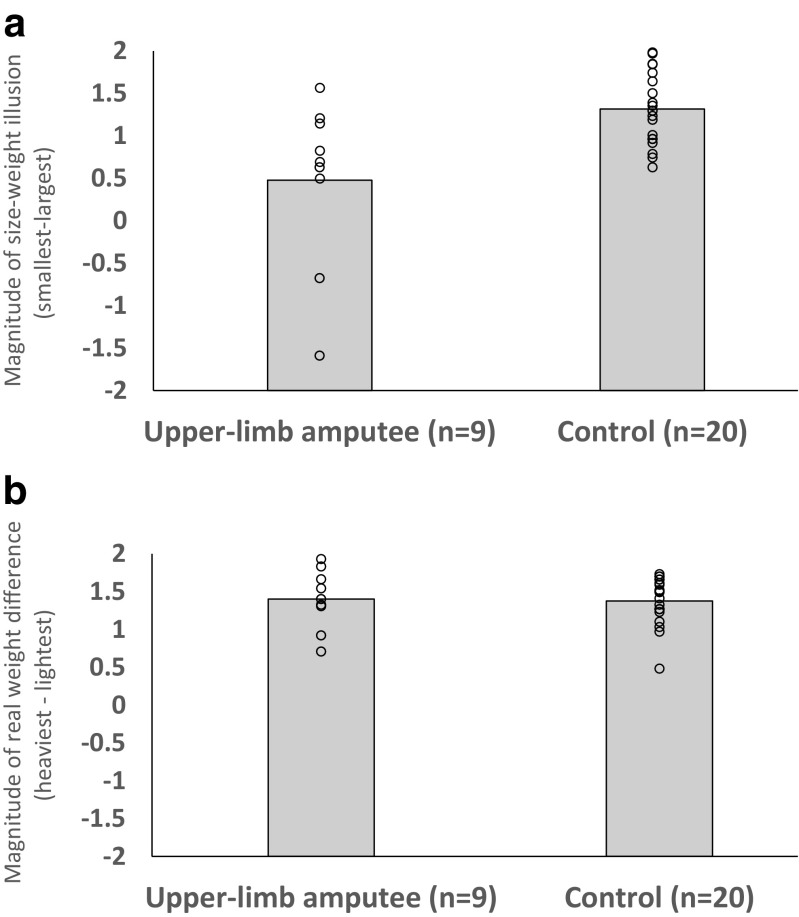
Fig. 3.
a Magnitude of the size–weight illusion experienced by both groups (calculated by subtracting the average ratings given to the largest objects from the average ratings given to the smallest objects). b Magnitude of the real weight difference experienced by both groups (calculated by subtracting the average rating given to the lightest objects from the average rating given to the heaviest objects). Positive numbers indicate an effect in the expected direction (i.e., experiencing heavy objects as feeling heavier than lighter object and experiencing smaller objects as feeling heavier than larger objects). The circles show individuals’ difference scores for these metrics

