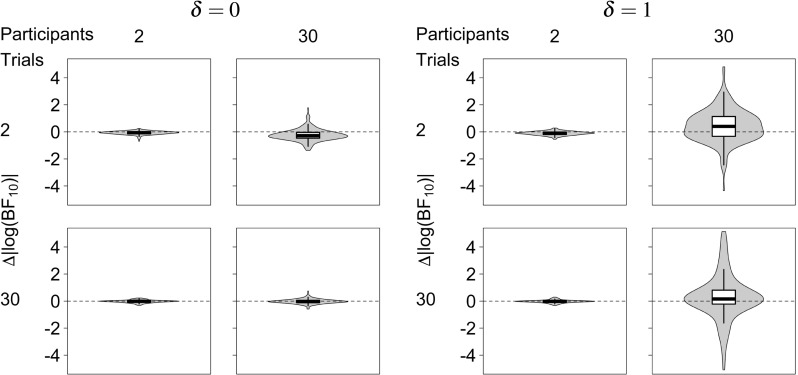
Fig. 5.

Differences between log-Bayes factors under the hierarchical and non-hierarchical Bayesian model. Violin plots show the distribution of differences between absolute log-Bayes factors, , for different numbers of simulated trials (K) and participants (N). Dashed horizontal lines indicate no difference in log-Bayes factors
