
Fig. 1.
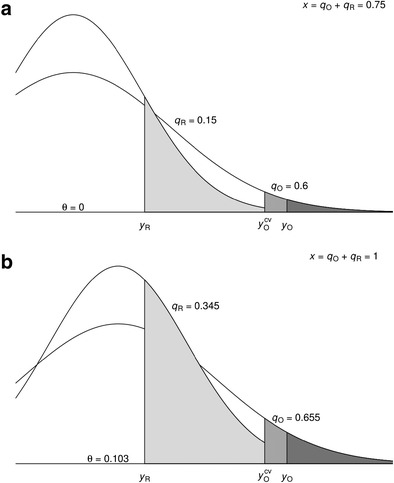
Effect size distributions of the original study and replication for the example presented in the introduction. Panels a and b refer to the effect size distributions for θ = 0 and θ = 0.103. y O and y R denote the observed effect sizes in the original study and replication, and denotes the critical value of the original study based on a two-tailed hypothesis test of H0: θ = 0 with α = .05. The shaded regions refer to probabilities larger than y R, y O, and . The (conditional) probabilities of the original study and replication are indicated by q O and q R, and their sum by x