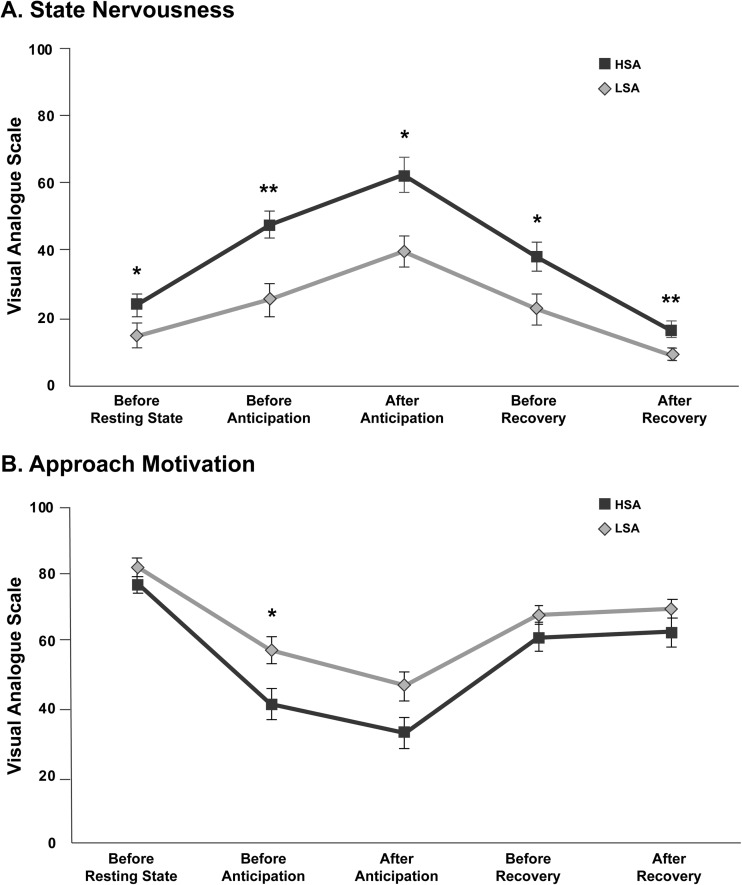
Fig. 2.
Self-report ratings of state nervousness (panel A) and approach motivation (panel B) after the resting state and SPT conditions for high socially (HSA) and low socially anxious (LSA) participants. Error bars represent standard errors of the mean. * Significant group difference at a FDR-corrected α-level of 0.05; ** Significant group difference at a FDR-corrected α-level of 0.01

