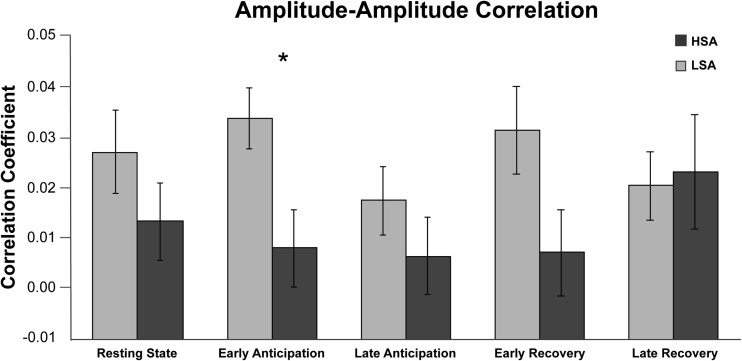
Fig. 4.
Delta-beta amplitude-amplitude correlation (AAC) during resting state and the SPT conditions for the high socially (HSA) and low socially anxious (LSA) participants. Note: Error bars reflect standard errors of the mean. LSA participants showed significantly more AAC than HSA participants during early anticipation at a FDR-corrected α-level of 0.05

