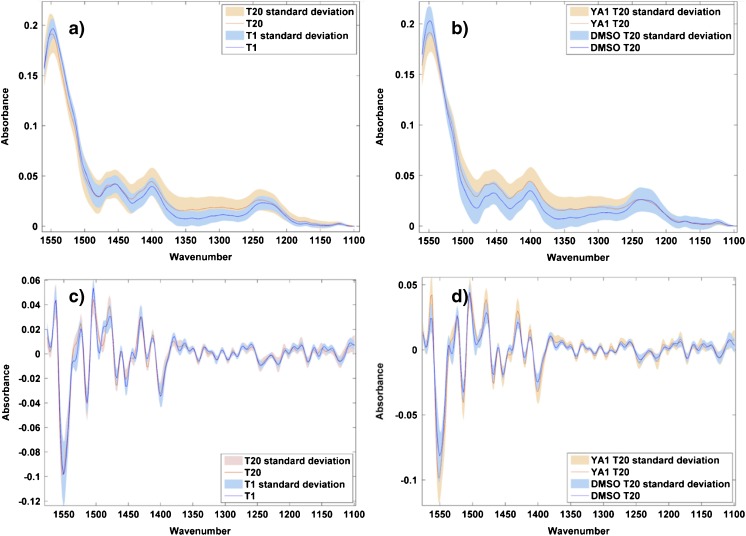
Fig. 4.
Normalised mean spectra of 120 cells, from three replicates, overlaid for YA1-treated cells after 1 and 20 h of drug treatment (a) and after 20 h of incubation with DMSO and drug (b). The corresponding second derivative spectra are shown in (c) and (d) to enhance spectral features corresponding to biological changed with drug treatment. The standard deviation of each spectrum is shown by the shaded area

