
Fig. 2.
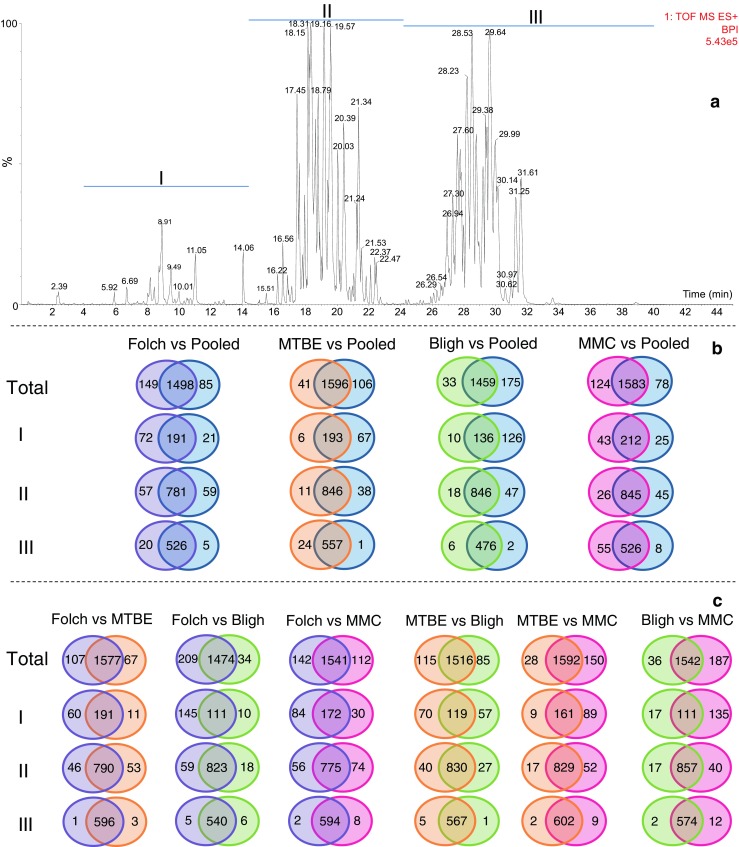
Selectivity of the extraction systems for different lipid species delimited by time windows and analyzed in positive ESI mode. (A) LC-MS chromatogram of lipids present in plasma samples. (B) Venn diagrams of the number of extracted features present in the pooled extract in comparison with the tested extraction methods. (C) Venn diagrams of the number of extracted features in the extracts of the tested approaches when compared with each other. The type of lipids in each segment of the chromatogram is as follows: segment I, lysophospholipids (LPL) and monoglycerides (MG); segment II, phospholipids (PI, PC, PE, and PG), sphingomyelins (SM), and diglycerides (DG); and segment III, cholesterol esters (CE) and triglycerides (TG)