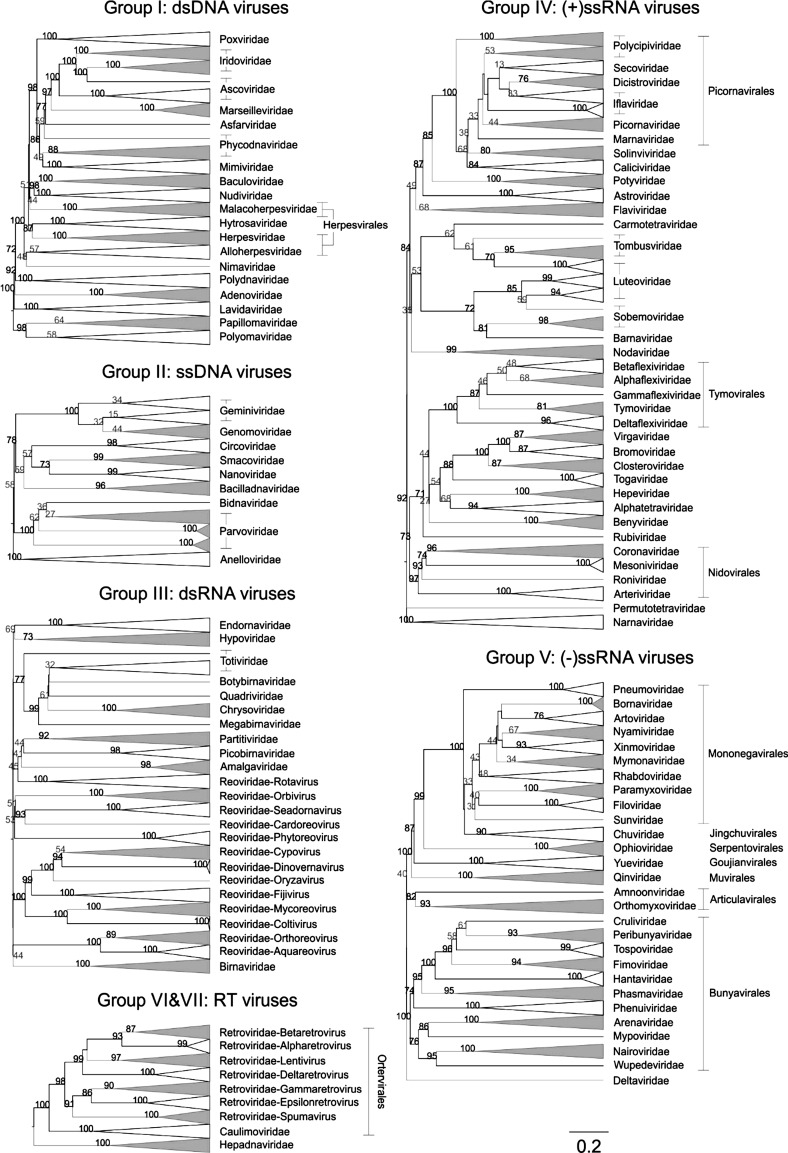
Fig. 2.
Virus dendrograms based on CGJ distances. UPGMA dendrograms were constructed from pairwise distance matrices, and the tips are labelled with current ICTV family and genus assignments. Virus taxonomy at the order level is also shown to the right of the dendrograms. The scale bar for the CGJ distance is shown at the bottom. Bootstrap clade support values of ≥ 30% are shown on the branches. Values ≥ 70% are in black, otherwise are in grey. Bootstrap support values for collapsed clades are shown regardless of the values. This figure has been modified from Fig. 2 in reference [5]

