Figure 6.

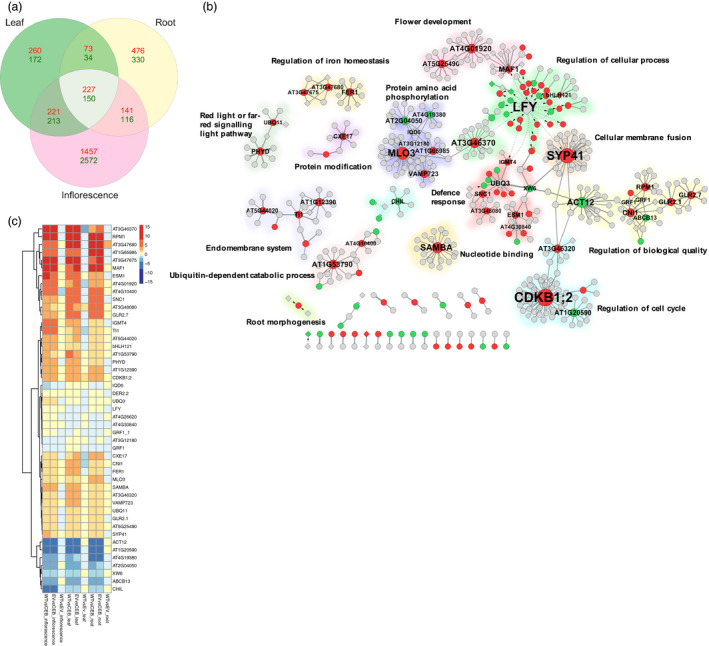
Functional network analysis of the mRNA gene expression in VvCEB1opt‐overexpressing lines compared with control lines. (a) Three‐way Venn diagram analysis of RNA‐Seq reads revealed distinct expression patterns between leaves, roots and inflorescence tissues. Numbers of genes that are differentially expressed between the Col‐0 wild‐type and 35S::3xHA empty‐vector control lines and the VvCEB1 opt ‐overexpressing line (#26) as determined by two or more methods (e.g. DESeq2, edgeR, ROTS and voom) with ≥twofold increase (red) or decrease (green) in relative transcript abundances and a false discovery rate (FDR) of less than 0.001. (b) Protein–protein and transcriptional regulatory network of differentially expressed genes shared among leaves, roots and inflorescences as determined by edgeR. Gene nodes with increased, decreased or unchanged mRNA expression are indicated by red, green or grey circles, respectively. The node size indicates the degree of connectivity of nodes. Nodes indicated by diamonds represent TFs. The edges shown in solid or dotted lines represent protein–protein or regulatory interactions, respectively. Arrows indicate activation, and short bars represent repression. Network modules enriched for gene ontology biological process terms are highlighted with different colours. (c) Heat map of hierarchical clustering analysis of networked genes with high connectivity (≥4) based on their topology coefficients representing similarities in gene expression profiles across all organ types as determined by edgeR. The colour scale indicates log2‐fold changes in mRNA abundance.
