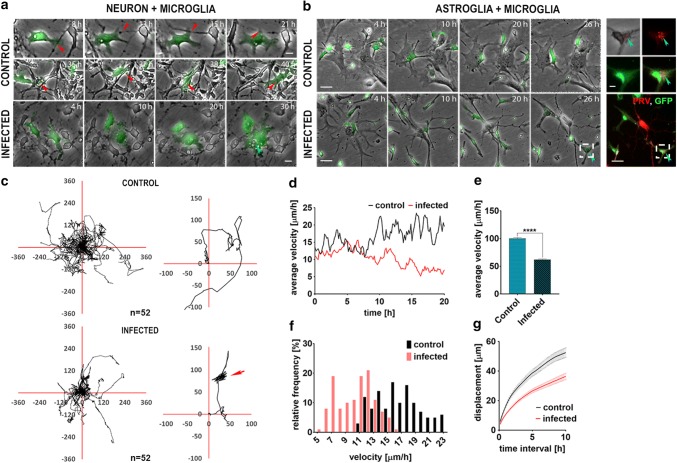
Fig. 3.
Virus infection triggers the recruitment and phagocytic activity of microglia in vitro. a Cx3Cr1+/gfp microglial cells (green) repeatedly interact with non-infected neuronal processes and cell bodies without hindering process outgrowth or affecting network stability. Red arrows point to an uninterruptedly growing neurite (upper panel and Supplementary Video 3.) or a microglia slipping under a dense neuronal network (mid panel and Supplementary Video 4.). Microglial cells contacting PRV-infected neurons flatten and phagocytose compromised cells (blue arrow, bottom panel), also see Supplementary Video 5. b Cx3Cr1+/gfp microglial cells (green) move freely in non-infected astroglial cultures making and releasing contacts with several astrocytes (upper panel and Supplementary Video 6.) while they are recruited to infected cells (bottom panel and Supplementary Video 7.) and after scanning they display phagocytic activity (blue arrow). Satellite images: PRV + particles (red), eaten up by a Cx3Cr1+/gfp microglial cell (green). c Trajectories of randomly chosen microglial cells (n = 52) over 24 h in control or infected astroglial cultures. Individual cell trajectories were centered to start from the origin and superimposed for better comparison of migration directionality. Insets show typical trajectories. Note the random walk behaviour in the trajectory in the upper inset (control), and the shorter trajectory with targeted directionality (arrow) characterizing the slower migrating and scanning microglial cells in infected cultures in the lower inset. d Time-dependent average velocities of microglial cell populations in control (n = 54) or infected (n = 56) astroglial cultures. e Average velocities of microglial cells over 24 h are significantly lower in infected astroglial cultures. f Frequency distribution of time-dependent average velocities of microglial populations in control or infected astroglial cultures. g Average displacement of microglial cells in various time intervals of migration in control or infected astroglial cultures. Error stripes correspond to s.e.m. Scale bars: a 10 µm; b 25 and 10 µm, respectively. Data are expressed as mean ± s.e.m. e n = 121, unpaired t test, ****p < 0.0001

