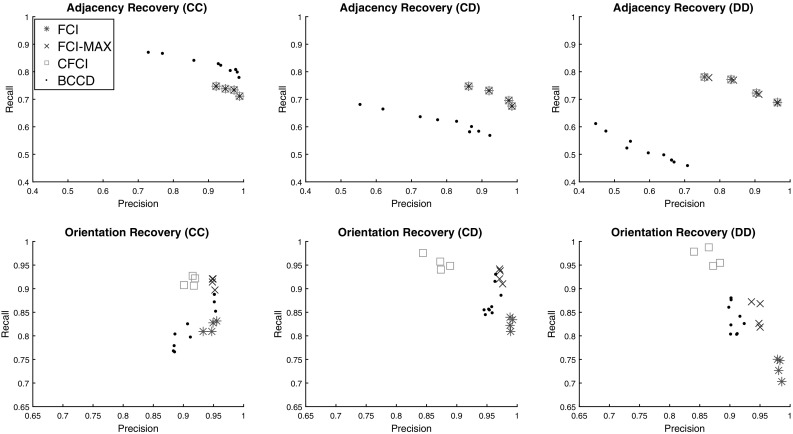
Fig. 1.

Precision-recall plots of FCI and related algorithms for 50 node scale-free networks with 1000 samples and 5 latent variables. Plots are separated by adjacency and orientation recovery in each row, and by edge type in each column; (CC), (CD) and (DD) refer to edges between two continuous variables, continuous and discrete variables, and two discrete variables, respectively
