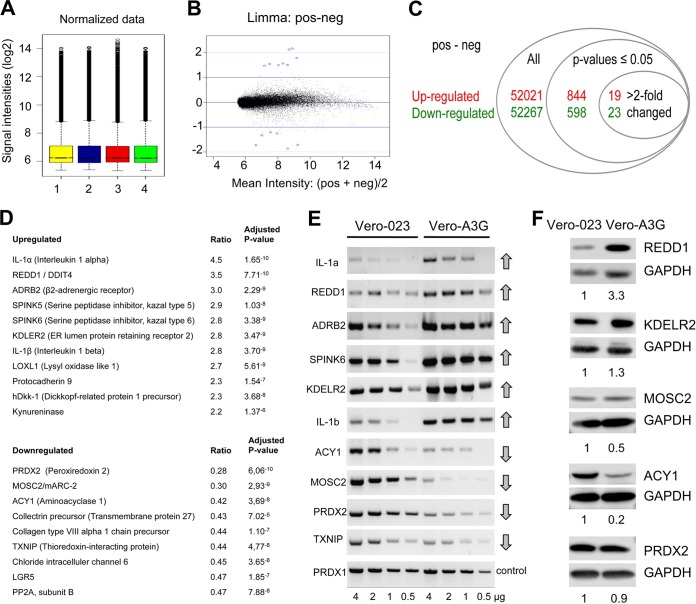
FIG 1.
Microarray analysis reveals A3G-upregulated and -downregulated genes. (A) Box plots of log2 values for quantile-quantile normalized probe signal intensities. Total RNA was isolated independently two times each from control Vero-023 cells and A3G-expressing Vero (Vero-A3G) cells and labeled. Bars 1 and 3, RNAs from Vero-023 control cells; bars 2 and 4, RNAs from Vero-A3G cells. The probes were hybridized to Gene Chip rhesus macaque genome arrays (Affymetrix) according to the manufacturer's instructions. (B) MA plot (intensity log2 fold change [M] plotted against the average log2 intensity [A]) for the comparison between treated and untreated cells. Mean intensities of both groups (x axis) were plotted against log2 fold change (y axis). Blue circles around dots show the first 15 genes with the lowest P values. (C) Numbers of all probe sets, of significantly (adjusted P values of <0.05) up- and downregulated probe sets, and of more than 2-fold-up- and downregulated probe sets. (D) List of the best up- and downregulated genes, with the alteration (ratio) of transcript expression and significance (adjusted P values) as determined by the four microarrays. (E) Total RNA was isolated from control (Vero-023) and A3G-expressing (Vero-A3G) cells. Four amounts of RNA (4, 2, 1, and 0.5 μg) were reverse transcribed into cDNA. Four microliters of each of cDNA product was amplified by PCR and analyzed on 1% agarose gels. (F) Protein lysates of Vero-023 and Vero-A3G cells were separated by 10% SDS-PAGE, blotted to nitrocellulose, incubated with antibodies to REDD1, KDELR2, MOSC2, ACY1, and PRDX2 (and GAPDH as a control), and visualized using the ECL system. Quantifications of the Western blots normalized to the value for Vero-023 cells are shown below each blot.

