
FIG 4.
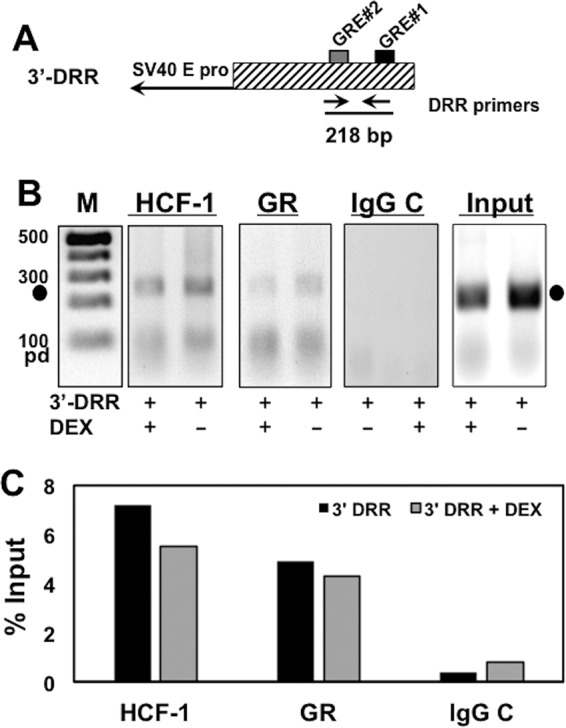
HCF-1 and GR occupy GRE sites of IEtu1 promoter in transfected cells. (A) Schematic of the 3′-DRR promoter construct. Location of the 3′-DRR primer pair and expected PCR fragment size are shown. (B) Neuro-2A cells were cotransfected with the plasmid expressing the mouse GR and the 3′-DRR reporter construct. Cultures were subsequently treated with 10 μM DEX (+) for 3 h. HCF-1 and GR occupancy were assessed by ChIP assays using the DRR primer set. IgG, control; input, 10% of total DNA; M, DNA size markers. The results are representative of three independent studies. Closed circles denote 217-bp PCR product. pd, primer dimer. (C) The intensity of bands in panel B was quantified using a Bio-Rad ChemiDoc system.