FIG 5.
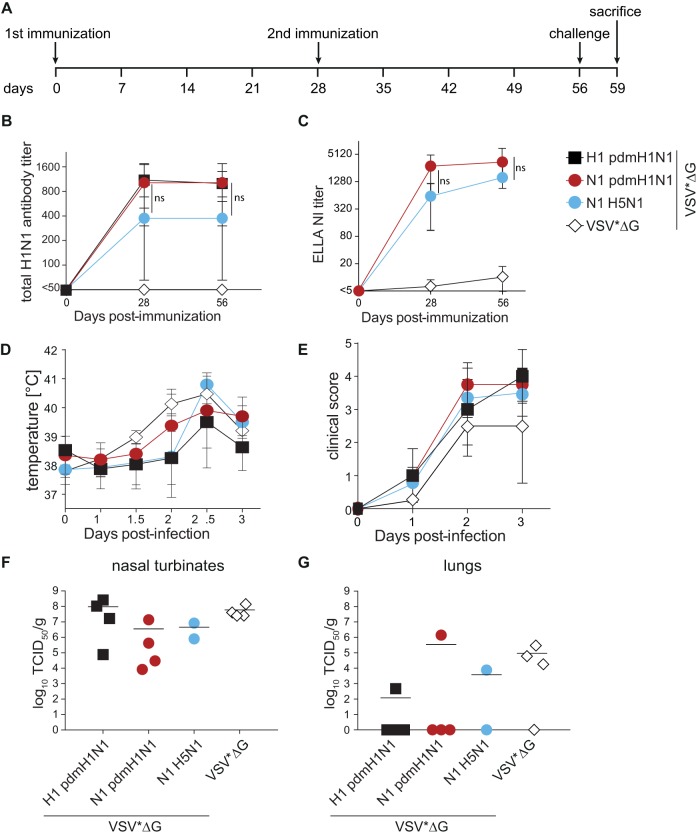
Humoral immune responses in ferrets induced by the different VSV*ΔG replicons and viral load after infection. (A) Schematic overview of the immunization-and-infection strategy and blood sampling time points. Naive ferrets were immunized twice with 108 FFU VSV*ΔG replicons intramuscularly. All animals were challenged intranasally with 105 TCID50 A/Mexico/InDRE4487/2009 and sacrificed for virus titration on day 3 after infection. (B and C) Kinetics of total antibody titers (B) and NI titers (C) against pdmH1N1 in animals immunized with matched or mismatched antigens. Log2-transformed groups were compared using two-way ANOVA with a Tukey posttest. (D and E) Temperature changes (E) and clinical scores (F) measured over 3 days after infection. Symbols represent the means for each group (n = 4; postinfection N1 H5N1, n = 2), and error bars indicate the standard deviations of the means. (F and G) Virus titers in the nasal turbinates (F) and lungs (G) in terms of TCID50 per gram on MDCK cells. Symbols indicate data for individual animals, and black bars represent the respective means.

