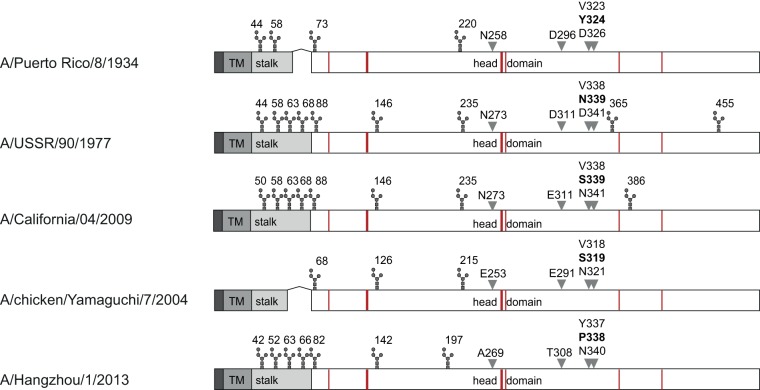
FIG 6.
Linear comparison of the NA proteins. The cytoplasmic domain, transmembrane region (TM), stalk region, and head domain are depicted in dark, medium and light gray, and white, respectively. Putative glycosylation sites are shown above, active sites are in red, and previously identified critical residues for inhibiting antibody binding are indicated by gray arrowheads and the respective amino acid numbering.

