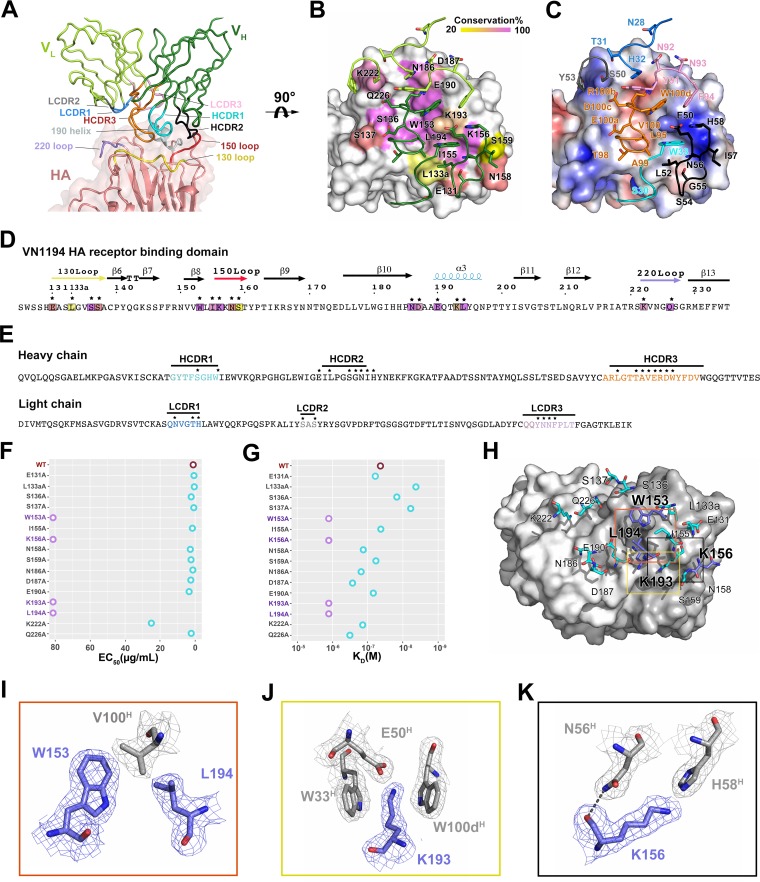
FIG 2.
Interaction analysis of the 13D4:HAhr immune complex. (A) Enlarged view of the interface of the 13D4:HAhr complex. (B) Sequence conservation of the 13D4 epitope. HAhr is shown in surface representation with epitope residues colored according to their conservation values. (C) The electrostatic potential surface of HA is depicted in gradient color: red, negative, −4 kT; blue, positive, +4 kT; white, neutral. Contacting residues of the 13D4 CDR loops are in stick form for side chains and cartoonform for main chains. Panels B and C are shown horizontally rotated 90° from panel A. (D and E) Sequences of the RBS domain and 13D4 CDR, respectively. The residues in the interface are marked with asterisks and are depicted with the same color scheme as in panels B and C. (F) Reactivity profiles of HA and its mutants against 13D4 antibody measured through sandwich ELISA. The EC50 values were calculated by sigmoidal fitting as shown in Fig. 3C. The EC50 is plotted as circles along the horizontal axis for each protein. Purple circles, EC50 of >80 μg/ml; cyan, <30 μg/ml; brown, wild-type HA. (G) Binding affinity measurements of HA and its mutants against 13D4 by SPR. The kinetic constants between bnAb 13D4 and W153A, K156A, K193A, and L194A mutants were not determinable and are reported as higher than 1,000 nM. The calculated affinity constants and fitting results are depicted in Fig. 3D. The KD values are plotted as circles along the horizontal axis for each protein. Purple circles, KD of >1,000 nM; cyan, <500 nM; brown, wild-type HA. (H) The 13D4 epitope sites for HA are depicted in stick form on the molecular surface of 13D4 Fab. The epitope residues were identified by the PISA server (Table 2). (I to K) Enlarged views of the interactions for W153 and L194 (red box), K193 (yellow box), and K156 (black box) from the corresponding boxes in panel H. Sample electron density (2Fo-Fc) maps contoured at 1 σ above the mean are shown for all the residues. Hydrogen bonds are shown as black dashed lines.

