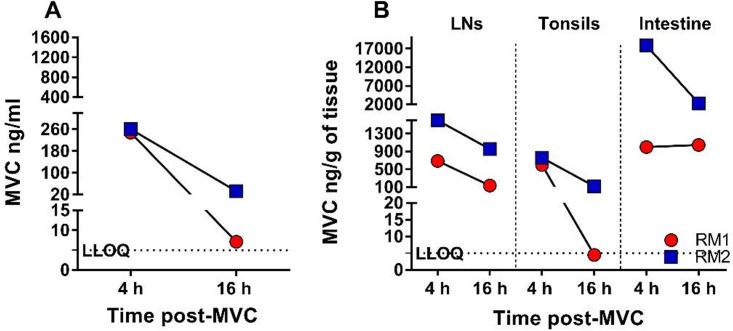
FIG 3.
Pharmacokinetic analysis of the MVC concentrations in the plasma and tissues of two infant RMs from the MVC-treated control group. (A) MVC concentrations in plasma at 4 h (maximum concentration) and 16 h (minimum concentration) after systemic administration of 150 mg/kg of MVC. The MVC concentration is expressed as nanograms per milliliter of plasma. (B) MVC concentrations in LNs, tonsils, and intestine at 4 h and 16 h after systemic administration. The MVC concentration is expressed as nanograms per gram of tissue. The black dotted lines show the lower limit of quantification (LLOQ; 5 ng/ml) of the bioanalytical LC-MS/MS method.

